AI Scientific Figure Generator
for Researchers
Create scientific illustrations, flowcharts, and data visualizations in one place. Describe your figure in a prompt or upload your data to get a first draft in under two minutes.
Trusted by 20,000+ researchers from leading institutions:
AI scientific illustration software for figures, mechanisms, and biological visuals
Create scientific illustrations for pathways, mechanisms, cell biology visuals, and experiment overviews. FigCanvas helps you turn a figure idea into a clean draft instead of starting from scratch. Describe the process or visual structure you want to show, then generate a figure you can refine for papers and slides.
Explore scientific illustration tools →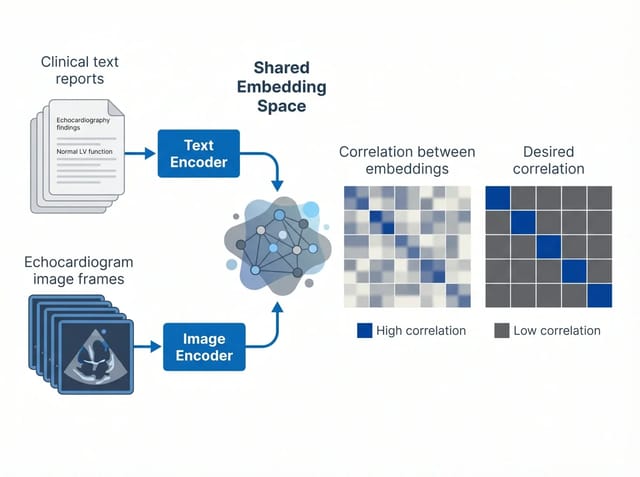 01 · Embedding
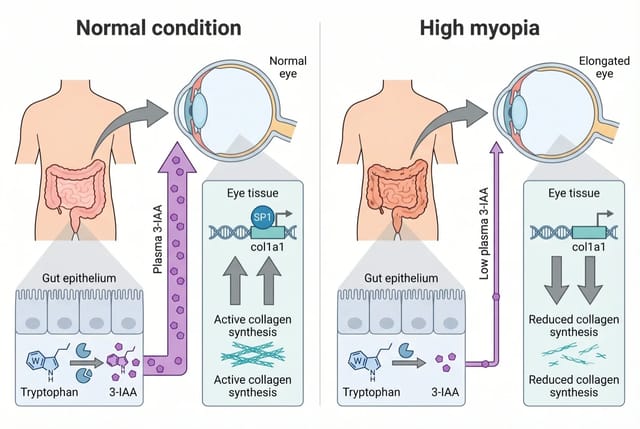 02 · Pathway
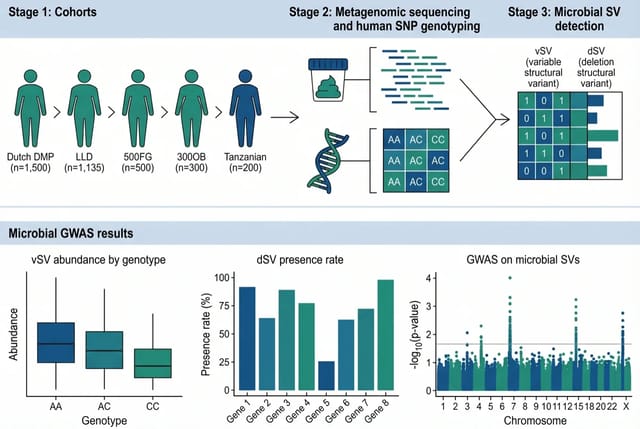 03 · Metagenomics
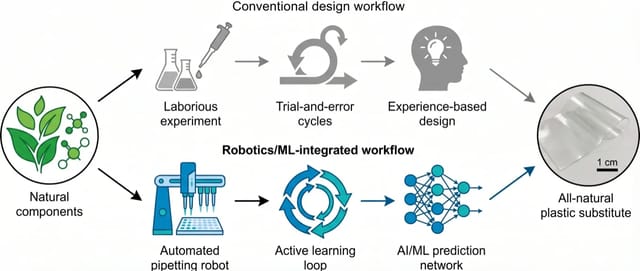 04 · Robotics
Turn data into publication-ready scientific visualizations
Upload your dataset or structured values to generate scientific visualizations faster, without rebuilding every figure manually. From volcano plots to other publication-ready visuals, FigCanvas turns raw data into figures that are easier to read and share.
Explore data visualization tools →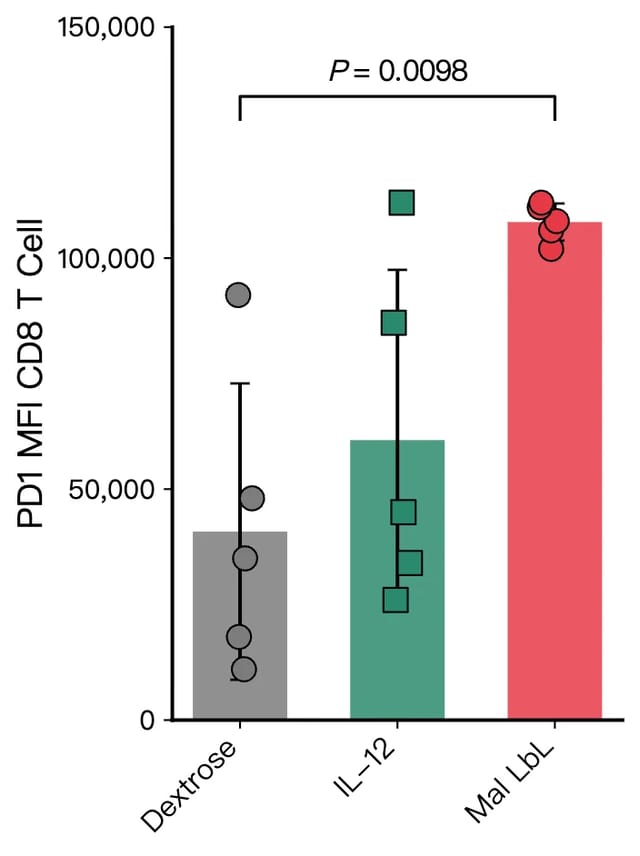 A · Bar chart
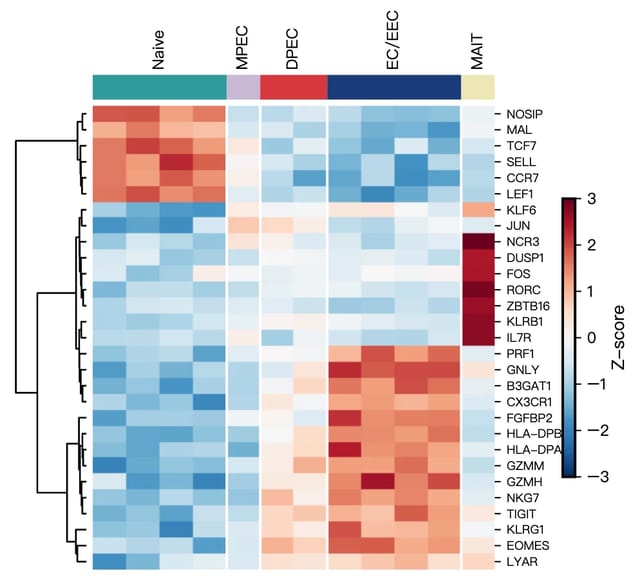 B · Heatmap
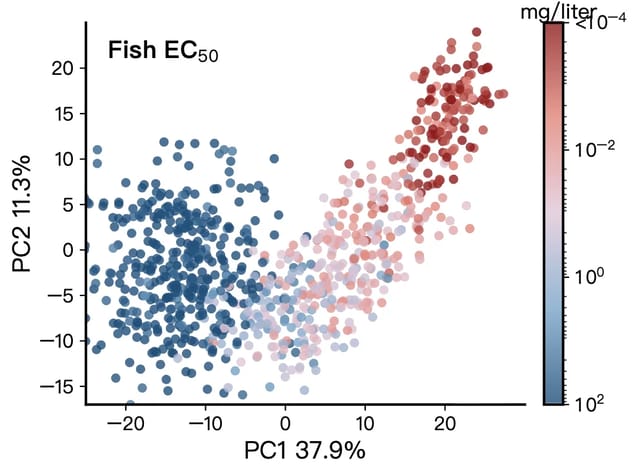 C · PCA
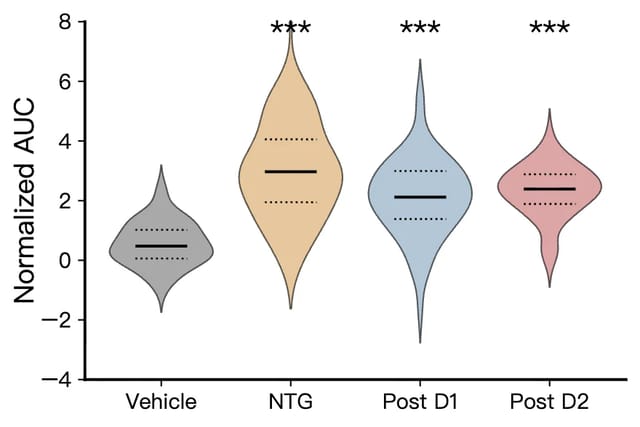 D · Violin
Turn methodology text into a flowchart instantly
Paste your methods section or protocol. FigCanvas extracts the steps and generates a clean, editable flowchart for experimental workflows, CONSORT diagrams, and bioinformatics pipelines. Ready for your manuscript or poster.
Try the flowchart maker →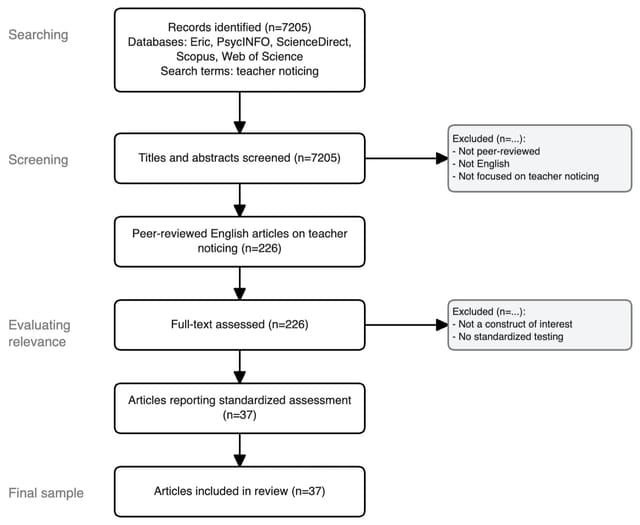 i · PRISMA
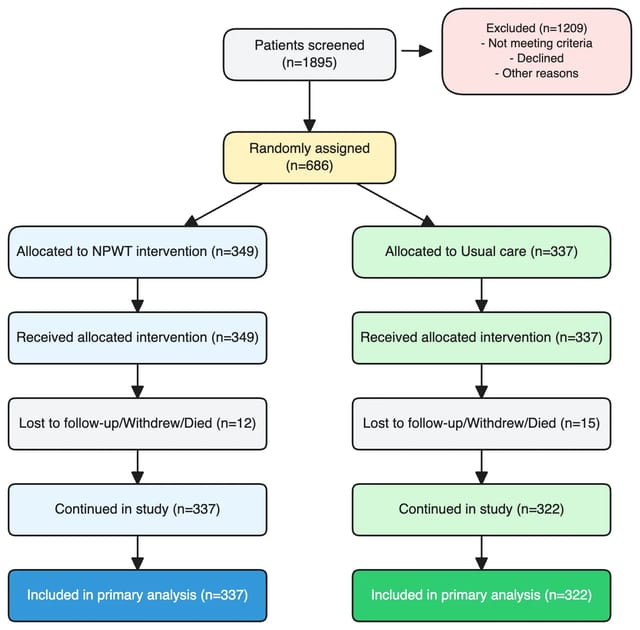 ii · CONSORT
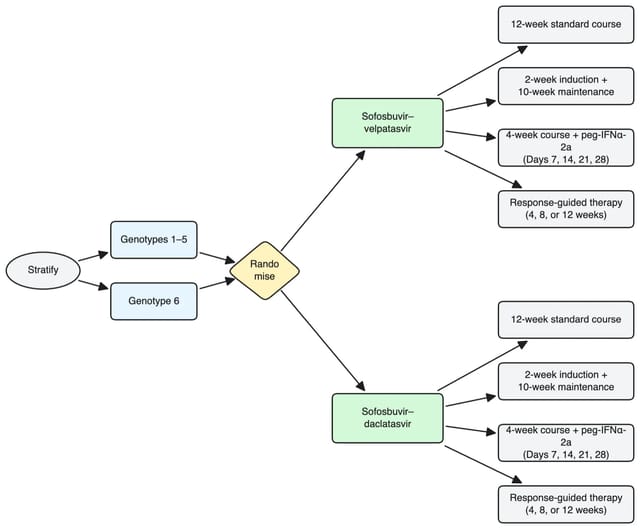 iii · RCT
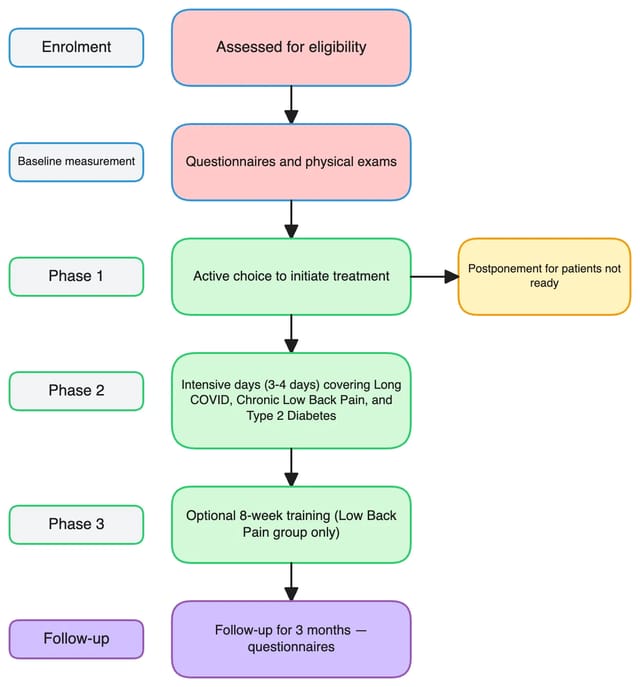 iv · Trial design
Infinite canvas for multi-panel scientific figures
Assemble multi-panel figures the way journals expect them. FigCanvas gives researchers an infinite canvas where data visualizations, scientific illustrations, and flowcharts live side by side. You stop juggling separate files or rebuilding layouts in PowerPoint.
Drag, align, and group panels with smart guides, then export the full composition as a publication-ready figure. It scales from a single plot to a 6-panel manuscript figure without breaking your workflow.
Sign up to try the infinite canvas →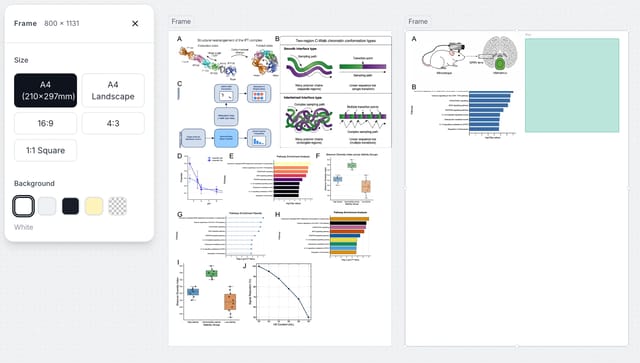
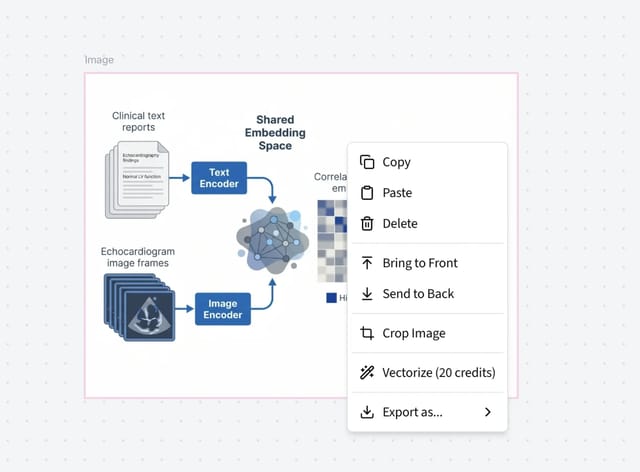
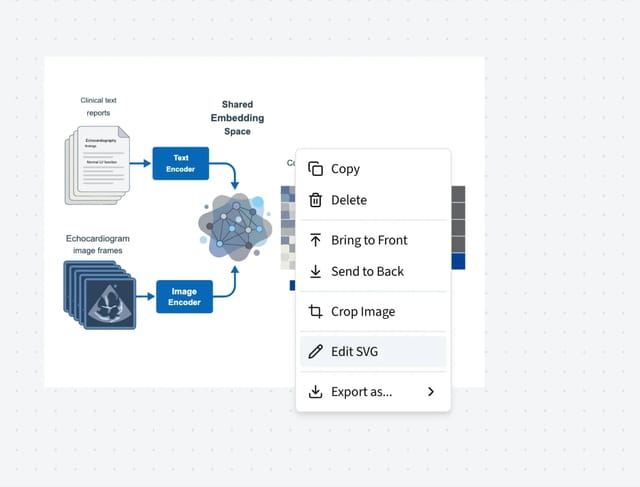
Export scientific figures as editable SVG
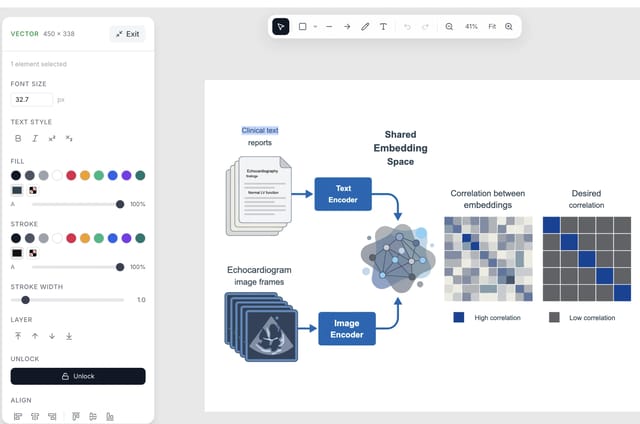
Every figure you generate can be converted to an editable SVG directly on FigCanvas. Adjust labels, colors, text, and individual elements right in your browser — no need to download and open in a separate tool.
You can also export as SVG, 300 DPI PNG, or PDF for manuscripts, posters, and presentations.
Calibrated to the visual standards of Nature, Science, and Cell
We studied thousands of figures from top-tier journals to learn what publication-ready actually means. Every chart, palette, and label placement reflects conventions real reviewers and editors expect.
You describe the result you want or upload your data. FigCanvas handles the color choices, typography, and layout, so your figure lands at journal quality on the first draft without you doing any design work.
Color palettes from peer-reviewed publications
No more Excel rainbow defaults. Palettes are sourced from journals that reviewers already trust.
Typography that matches journal style guides
Font sizing, label placement, and spacing follow the conventions top publications use.
Chart conventions reviewers expect
Error bars, axis labels, and significance markers land in the right places by default.
How FigCanvas works
FigCanvas is scientific figure software built to help researchers create scientific illustrations, data visualizations, and flowcharts from prompts or data.
Describe your figure or upload your data
Start with a plain-language prompt, methodology text, or a dataset. FigCanvas supports scientific illustration, data visualization, and flowchart workflows in one place.
Generate a draft with AI
Use FigCanvas to generate a working first draft in under two minutes. Whether you need biological visuals, data visualizations, or flowcharts, the system picks the right figure type for your input.
Edit, arrange, and export
Refine labels, prompts, and layout after generation, then export in PNG, SVG, or PDF. Use the infinite canvas to build cleaner multi-panel figures for papers and posters.
Why choose FigCanvas scientific figure software
One tool for all your research figures. Faster and cheaper than anything else in your workflow.
No coding required
Upload data or describe your figure in plain language to create visuals without writing code or building everything manually.
Built for scientific figure workflows
Built as scientific figure software for researchers, FigCanvas supports scientific illustration, data visualization, and flowchart workflows in one place.
Editable output with SVG support
Generate a draft quickly, then refine labels, layout, and details with editable output and SVG export.
Infinite canvas for multi-panel figures
Use an infinite canvas with smart alignment to arrange charts, illustrations, and annotations into cleaner multi-panel figures for papers and presentations.
AI-powered draft generation
Use FigCanvas to turn prompts, paper summaries, and datasets into editable draft figures in minutes.
Turn data into the right chart automatically
Instead of deciding between a scatter plot, volcano plot, or other chart types on your own, upload your data and let FigCanvas suggest the best visual starting point.
Looking for a BioRender alternative?
See how FigCanvas compares to BioRender for graphical abstracts, scientific illustrations, workflow diagrams, and data charts — and when an AI-assisted workflow may be a better fit.
Frequently Asked Questions
FigCanvas is an AI-powered scientific figure tool built for researchers, students, and academic teams. It helps you create publication-ready scientific illustrations, data visualizations, and flowcharts without needing design skills or coding knowledge.
Yes. The free tier gives you 18 credits per day for your first 3 days as a welcome bonus, then 10 credits per day thereafter — enough for multiple figures every day, with full publication rights. No credit card required.
figcanvas generates data plots (bar charts, scatter plots, heatmaps, volcano plots), scientific illustrations (cell diagrams, pathway figures, mechanism diagrams), flowcharts, and more.
Yes. All figures are royalty-free and can be published in Nature, Science, Cell, ACS journals, and any other academic publication without additional licensing.
Free users export PNG. Pro users export high-resolution PNG (300 DPI), editable SVG, and PDF. All formats are accepted by major journals and suitable for conference posters.
No. figcanvas is designed for researchers, not developers. You describe what you want in plain language and the AI handles the rest.
Yes. Data visualizations and flowcharts are directly editable on the canvas. For scientific illustrations, FigCanvas can convert the generated figure into an editable vector which you can refine element by element.
Your next figure,
ready in minutes
Stop spending afternoons adjusting colors and labels in Illustrator.