AI Scientific Data Visualization
for Research Data
Upload your CSV or Excel file, and FigCanvas analyzes your data, recommends suitable chart types, and helps you generate publication-ready scientific plots without writing code.
Try a sample dataset or upload your own
Upload your data file
Drag and drop your CSV or Excel file here to start generating scientific plots and charts.
Example scientific data visualizations generated from research data
What researchers uploaded or described → what FigCanvas generated.
Scientific data visualization types FigCanvas can generate
From differential expression analysis to clinical and multi-omics studies, FigCanvas helps researchers turn structured data into the right figure format.
Differential Expression Plots
Create volcano plots and related differential analysis visuals from RNA-seq, proteomics, and other omics workflows.
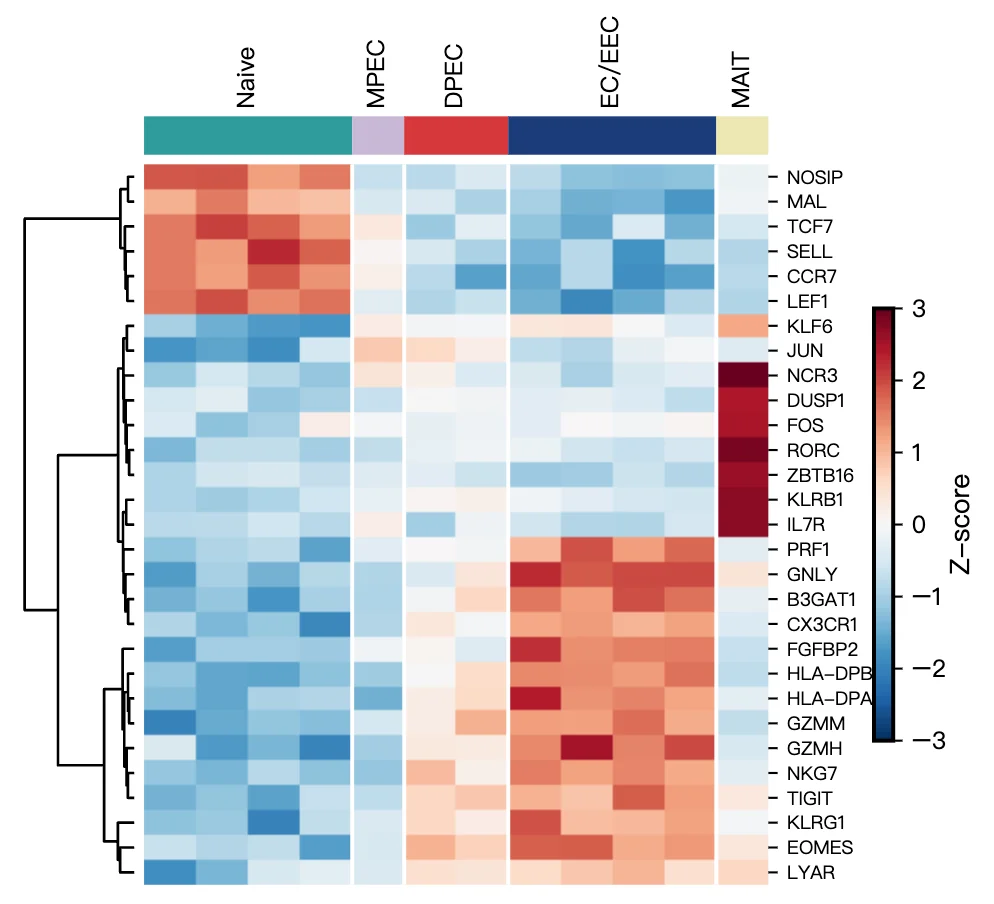
Expression and Matrix Visualizations
Generate heatmaps, clustered expression matrices, and feature-level comparison views for transcriptomics and proteomics data.
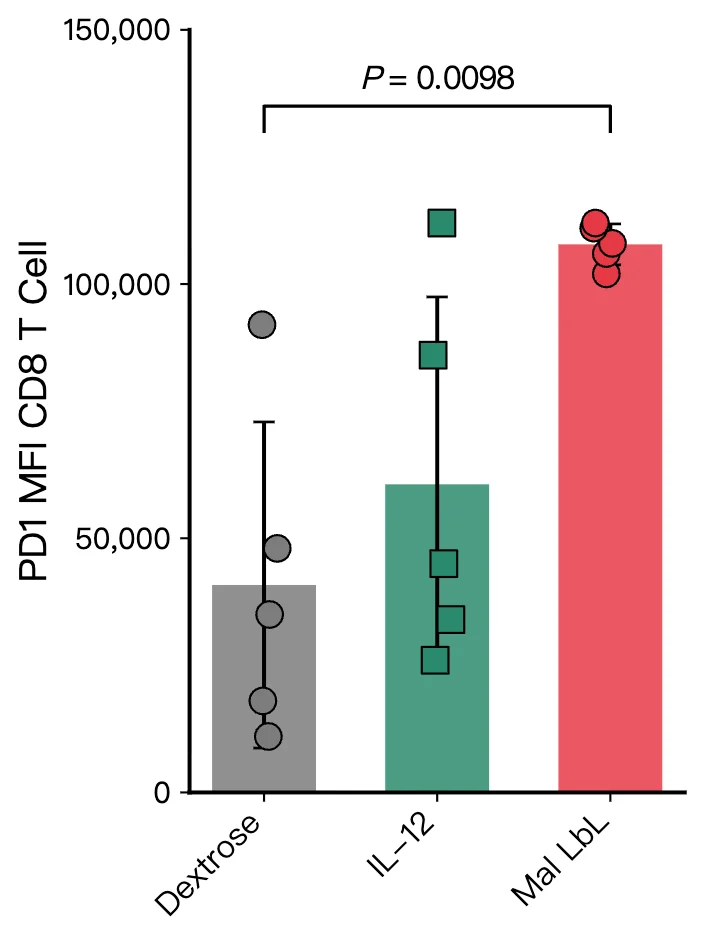
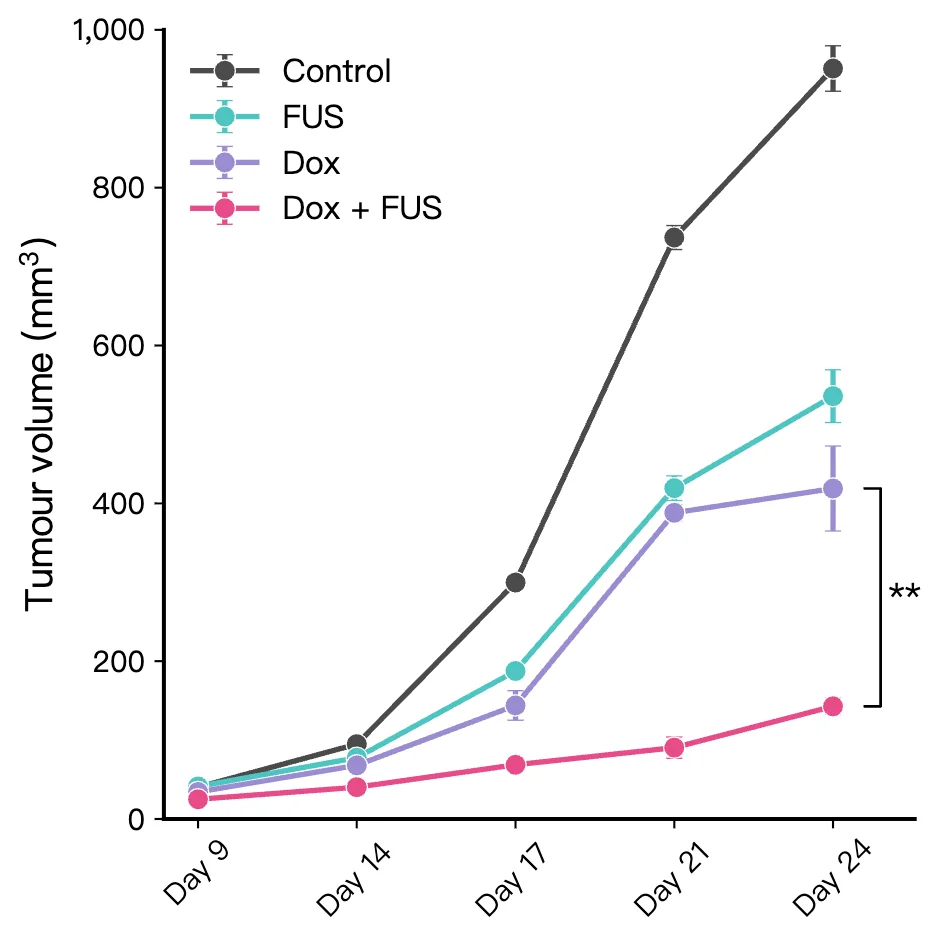
Statistical Comparison Charts
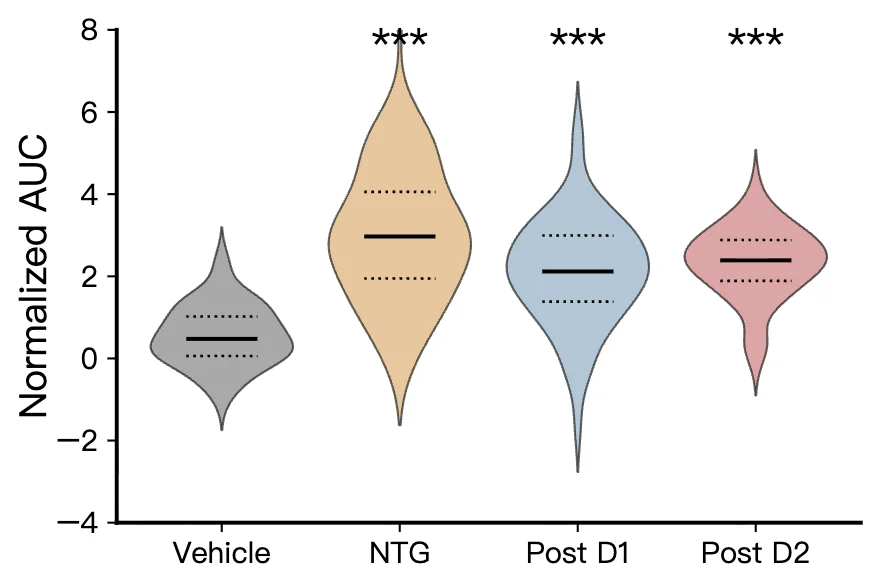
Build bar charts, box plots, violin plots, and grouped comparisons with clear labels and publication-ready styling.
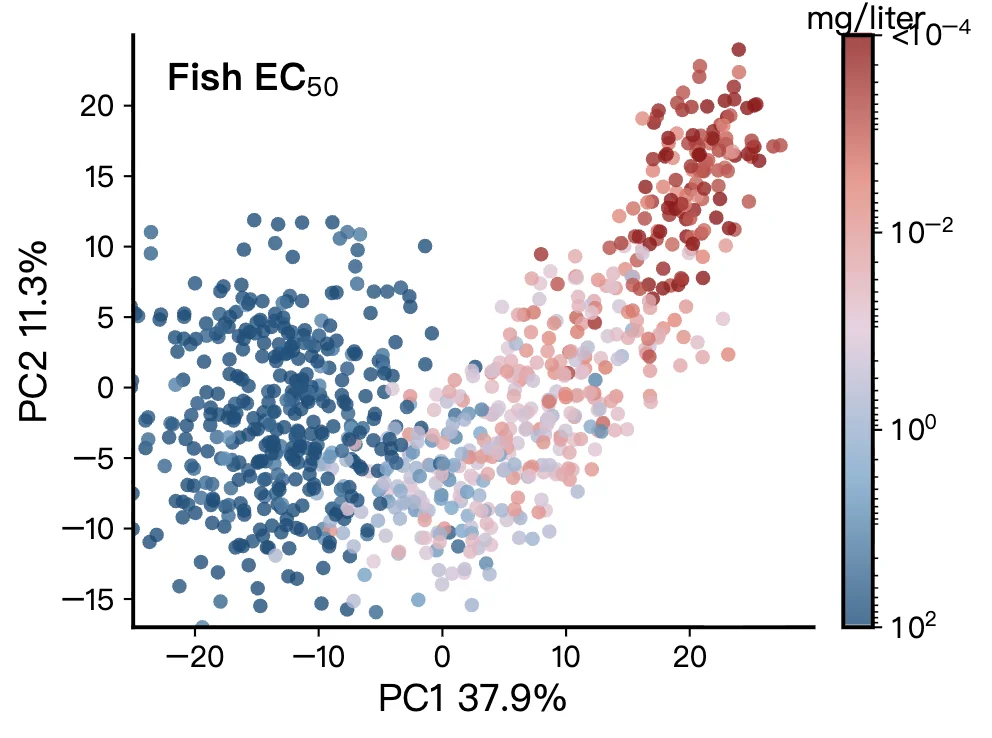
Correlation and Dimensionality Reduction
Create scatter plots, PCA plots, and correlation matrices for exploratory analysis and result presentation.
Survival and Clinical Outcome Plots
Visualize time-to-event outcomes, subgroup comparisons, and clinical result patterns for translational research workflows.
Meta-analysis and Comparative Figures
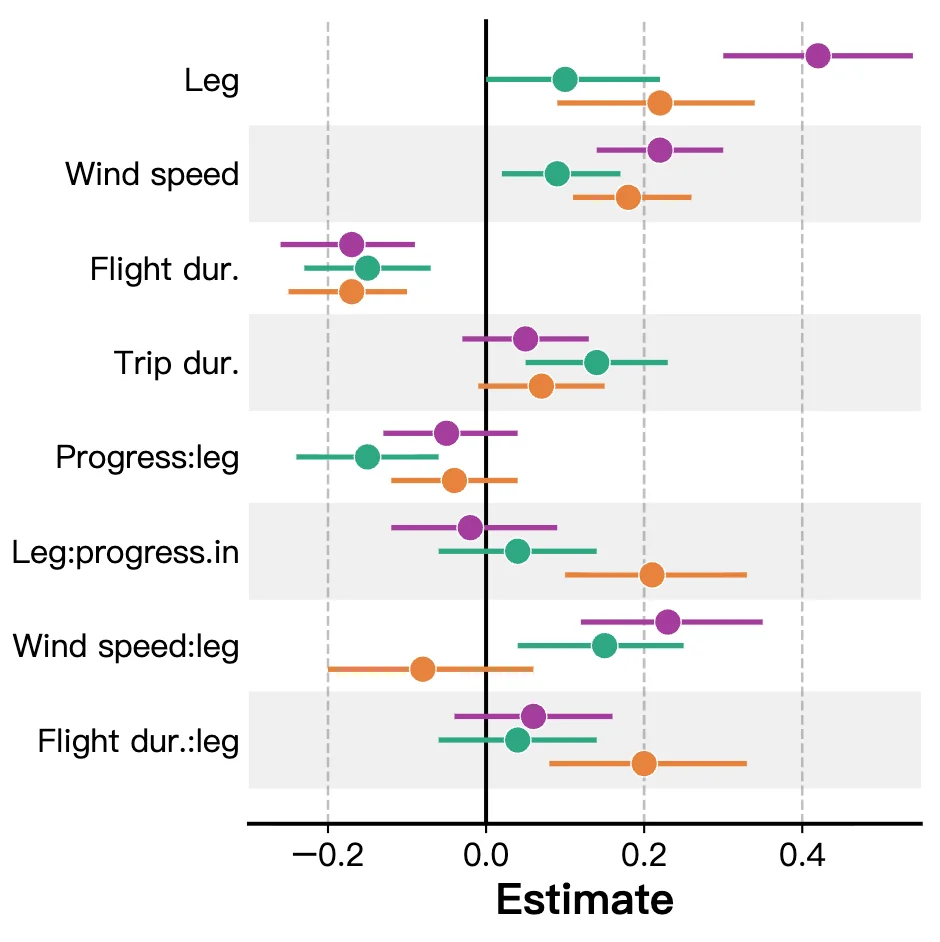
Generate forest plots and other comparative visualizations for multi-study, multi-condition, and review-oriented datasets.
How FigCanvas works
Go from uploaded data to an editable scientific figure in four steps.
Upload your research data
Upload CSV or Excel files from RNA-seq, proteomics, clinical studies, or other structured analysis workflows.
Analyze the data structure
FigCanvas detects column types, numeric fields, group variables, and statistical values to understand what your dataset supports.
Recommend the right plot type
Based on your data structure, FigCanvas recommends suitable visualizations such as volcano plots, heatmaps, box plots, scatter plots, or survival curves.
Generate, refine, and export
Create the figure, refine labels and styling, and export your scientific data visualization as SVG, PNG, or PDF.
Why FigCanvas creates better scientific data visualizations
Built around real research data workflows
FigCanvas is designed for structured research datasets, including omics outputs, grouped comparison tables, survival results, and other scientific analysis formats.
Recommends plot types instead of making you guess
Instead of asking you to pick a chart type first, FigCanvas analyzes your uploaded file and helps identify which visualizations make sense for the data you have.
Publication-ready styling by default
Generated figures follow common scientific figure conventions, with cleaner layouts, readable labels, balanced visual emphasis, and export-friendly styling.
Editable and exportable for manuscripts and slides
You can refine the resulting figure and export it as SVG, PNG, or PDF for papers, posters, presentations, and other research communication workflows.
Scientific data visualization for research workflows
Turn structured data into figures for analysis, publication, and scientific communication.
For RNA-seq and differential expression analysis
Create volcano plots, expression summaries, and other figures from DESeq2, edgeR, limma, and similar analysis outputs.
For proteomics, metabolomics, and multi-omics studies
Visualize feature-level differences, clustered expression patterns, and dimensionality reduction results across complex omics workflows.
For clinical and comparative studies
Generate survival plots, grouped comparisons, and correlation-based visualizations for translational and clinical research datasets.
For papers, posters, and presentations
Export publication-ready figures for manuscripts, conference posters, lab meetings, and other scientific communication workflows.
Scientific Data Visualization FAQs
FigCanvas accepts CSV and Excel files. Any tabular data works as long as the file has clear column headers.
Depending on your dataset, FigCanvas can recommend volcano plots, heatmaps, bar charts, box plots, violin plots, scatter plots, PCA plots, survival curves, forest plots, correlation matrices, and other scientific visualizations.
FigCanvas uses AI to convert your description into plotting code, executes it in a secure cloud sandbox, and returns the resulting figure based on your actual data.
Yes. FigCanvas works from the file you upload and generates figures based on your actual dataset rather than producing a generic placeholder image.
Yes. You can start by uploading your file from the landing page, sign in when prompted, and continue the workflow without losing the uploaded data.
Yes. FigCanvas supports SVG, PNG, and PDF export so you can use the output in manuscripts, posters, presentations, and other research workflows.
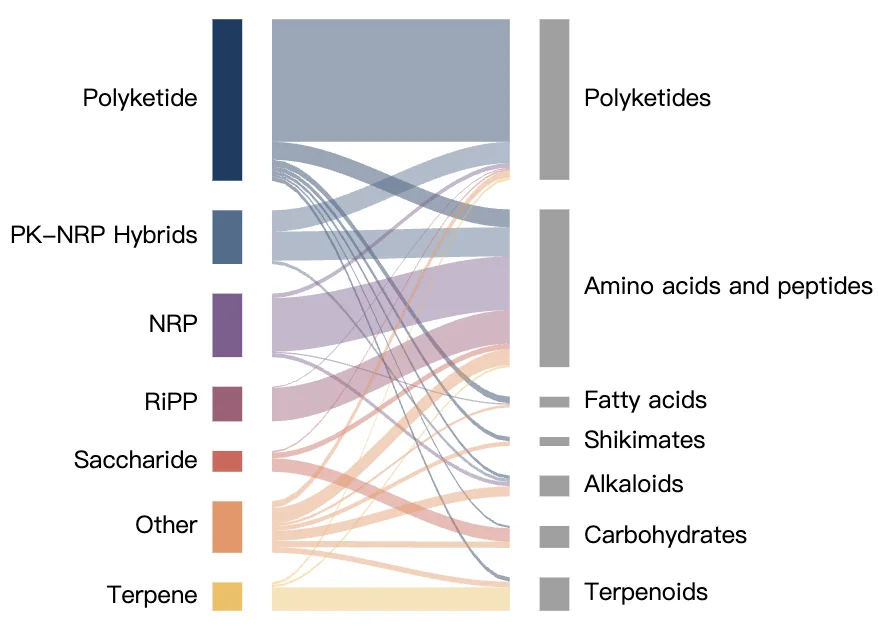
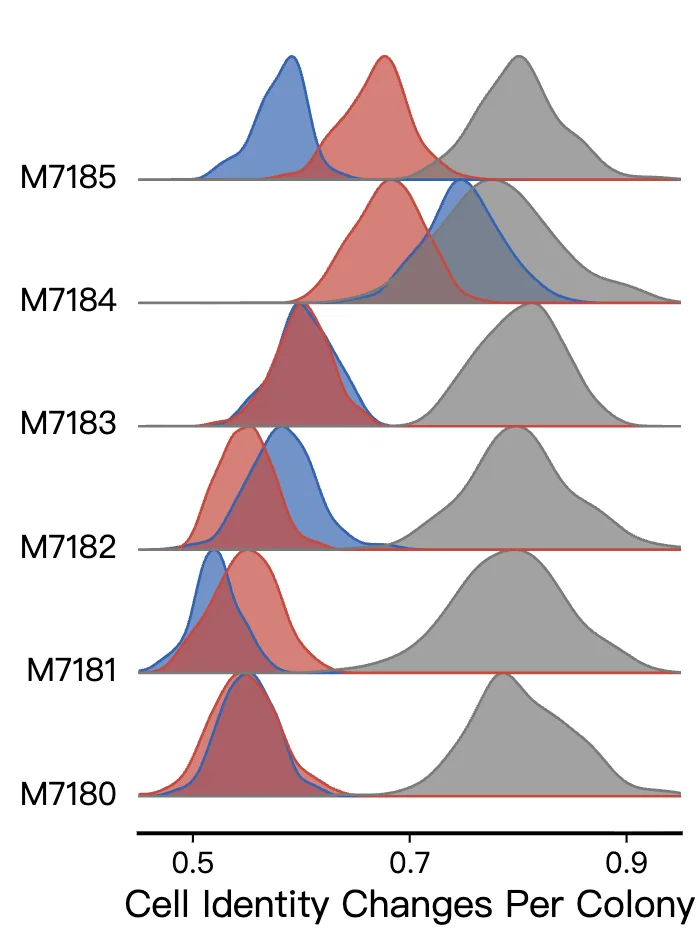
FigCanvas covers most everyday scientific charts — bar plots, boxplots, violin plots, scatter plots, line charts, histograms, density plots — as well as more involved figures like Sankey diagrams, heatmaps, ridge plots, alluvial flows, forest plots, and PCA biplots. If your data fits in a CSV or Excel sheet, the chart recommender will usually find a sensible starting point.
Turn your data into publication-ready figures
Upload CSV or Excel files and generate scientific data visualizations — volcano plots, heatmaps, bar charts, and more — without writing code.