Scientific Flowchart
Maker for Research
Create scientific flowcharts for experimental workflows, study design diagrams, research process visuals, and analysis pipelines from plain-language prompts.
Scientific flowchart examples from research workflows
Explore example prompts and outputs for experimental workflows, study design diagrams, research process flowcharts, and analysis pipelines.
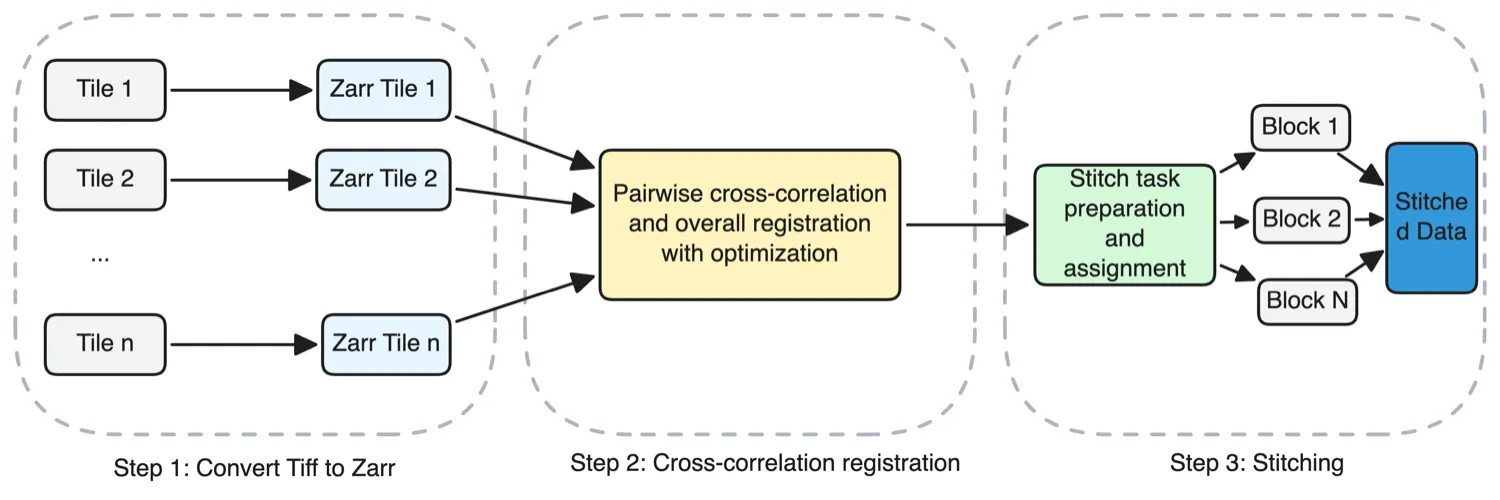
A left-to-right three-step pipeline for stitching large microscopy tiles. Step 1 "Convert Tiff to Zarr" shows a vertical stack of input tiles labelled Tile 1, Tile 2, ..., Tile n on the left, each with an arrow crossing into a matching stack of Zarr tiles on the right. Step 2 "Cross-correlation registration" collapses all the Zarr tiles into a single node "Pairwise cross-correlation and overall registration with optimization". Step 3 "Stitching" starts with "Stitch task preparation and assignment for the blocks", which fans out into a vertical stack of blocks labelled Block 1, Block 2, ..., Block N, all of which merge into a final "Stitched data" box. Each step is enclosed in its own dashed grouping frame with a caption underneath. Layout and composition are up to the agent. Keep the three steps visually distinct and the tile-to-block transformation readable. don't use mermaid
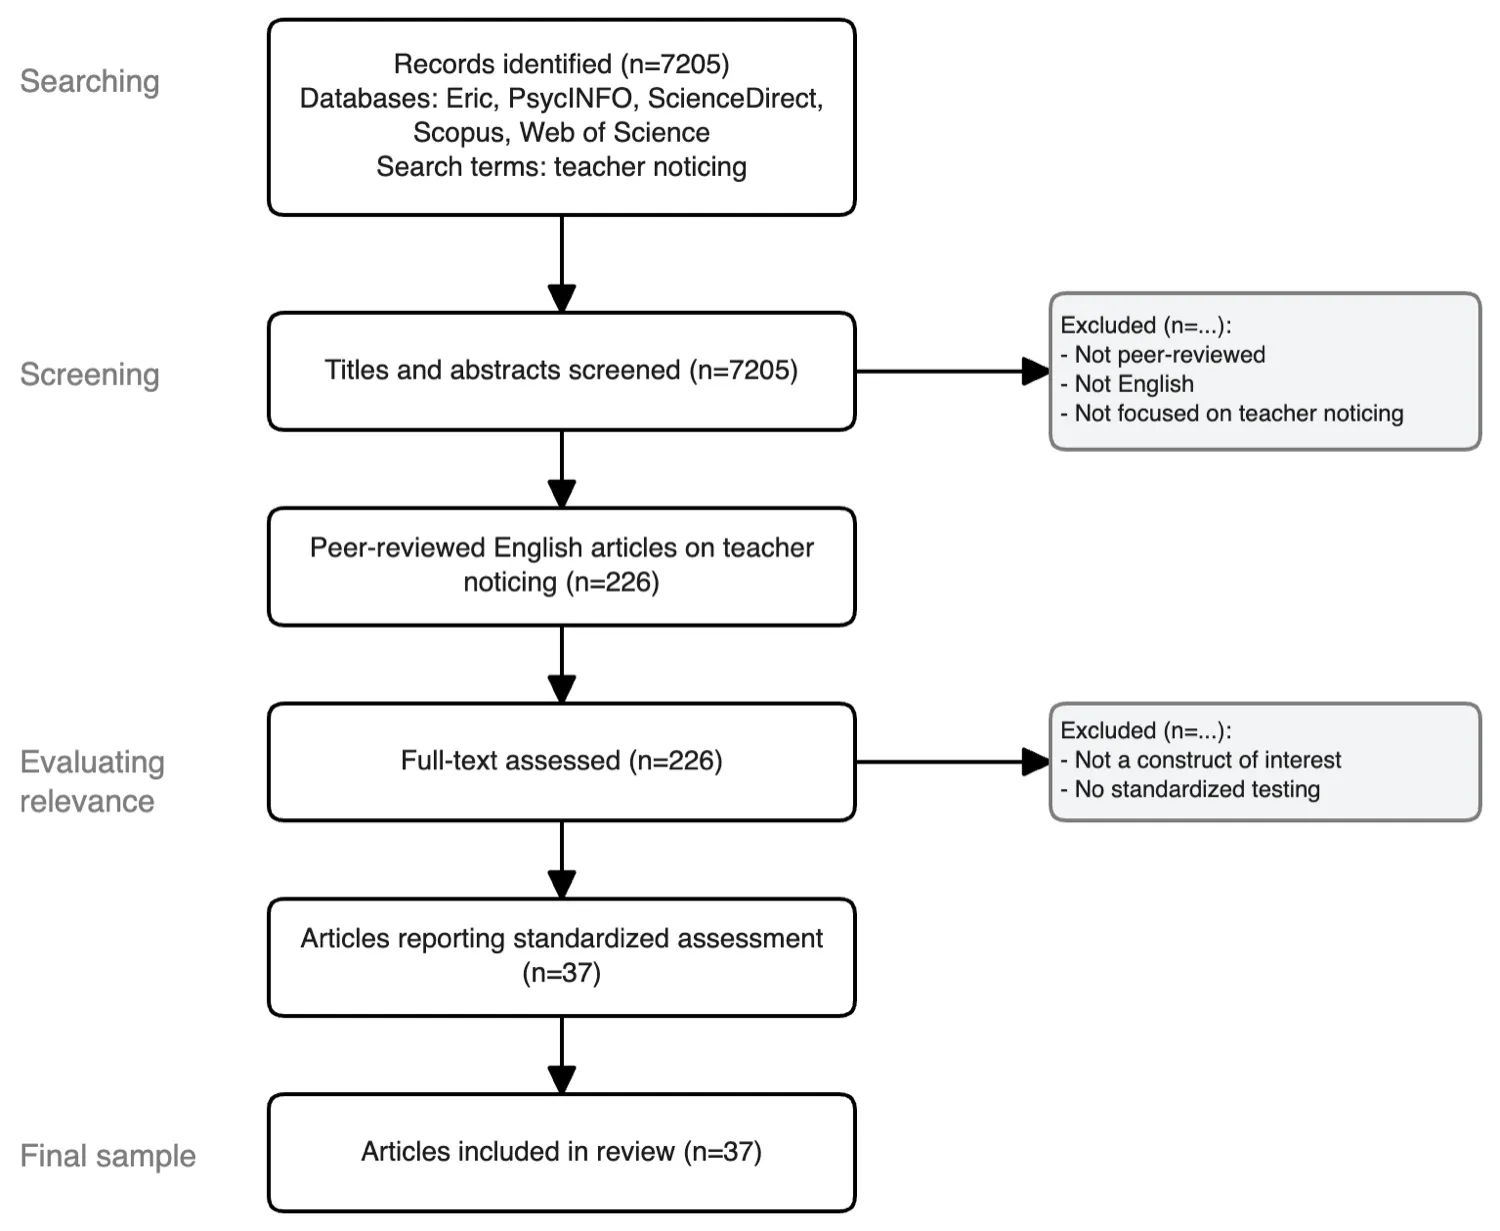
A vertical four-stage literature screening diagram for a scoping review on teacher noticing. Stage "Searching" starts with a box listing databases (Eric, PsycINFO, ScienceDirect, Scopus, Web of Science) and the search terms, ending with "Records identified (n=7205)". An arrow drops to stage "Screening", a box "Titles and abstracts screened (n=7205)", with a side arrow branching right to an exclusions box listing three reasons (not peer-reviewed, not English, not focused on teacher noticing). The spine resumes with "Peer-reviewed English articles on teacher noticing (n=226)". Stage "Evaluating relevance" contains "Full-text assessed (n=226)", another side exclusion for two reasons (not a construct of interest, no standardized testing), then "Articles reporting standardized assessment (n=37)". The final stage "Final sample" ends at "Articles included in review (n=37)". Stage labels appear as vertical tags on the left. Layout and composition are up to the agent. use template 33400 don't use mermaid
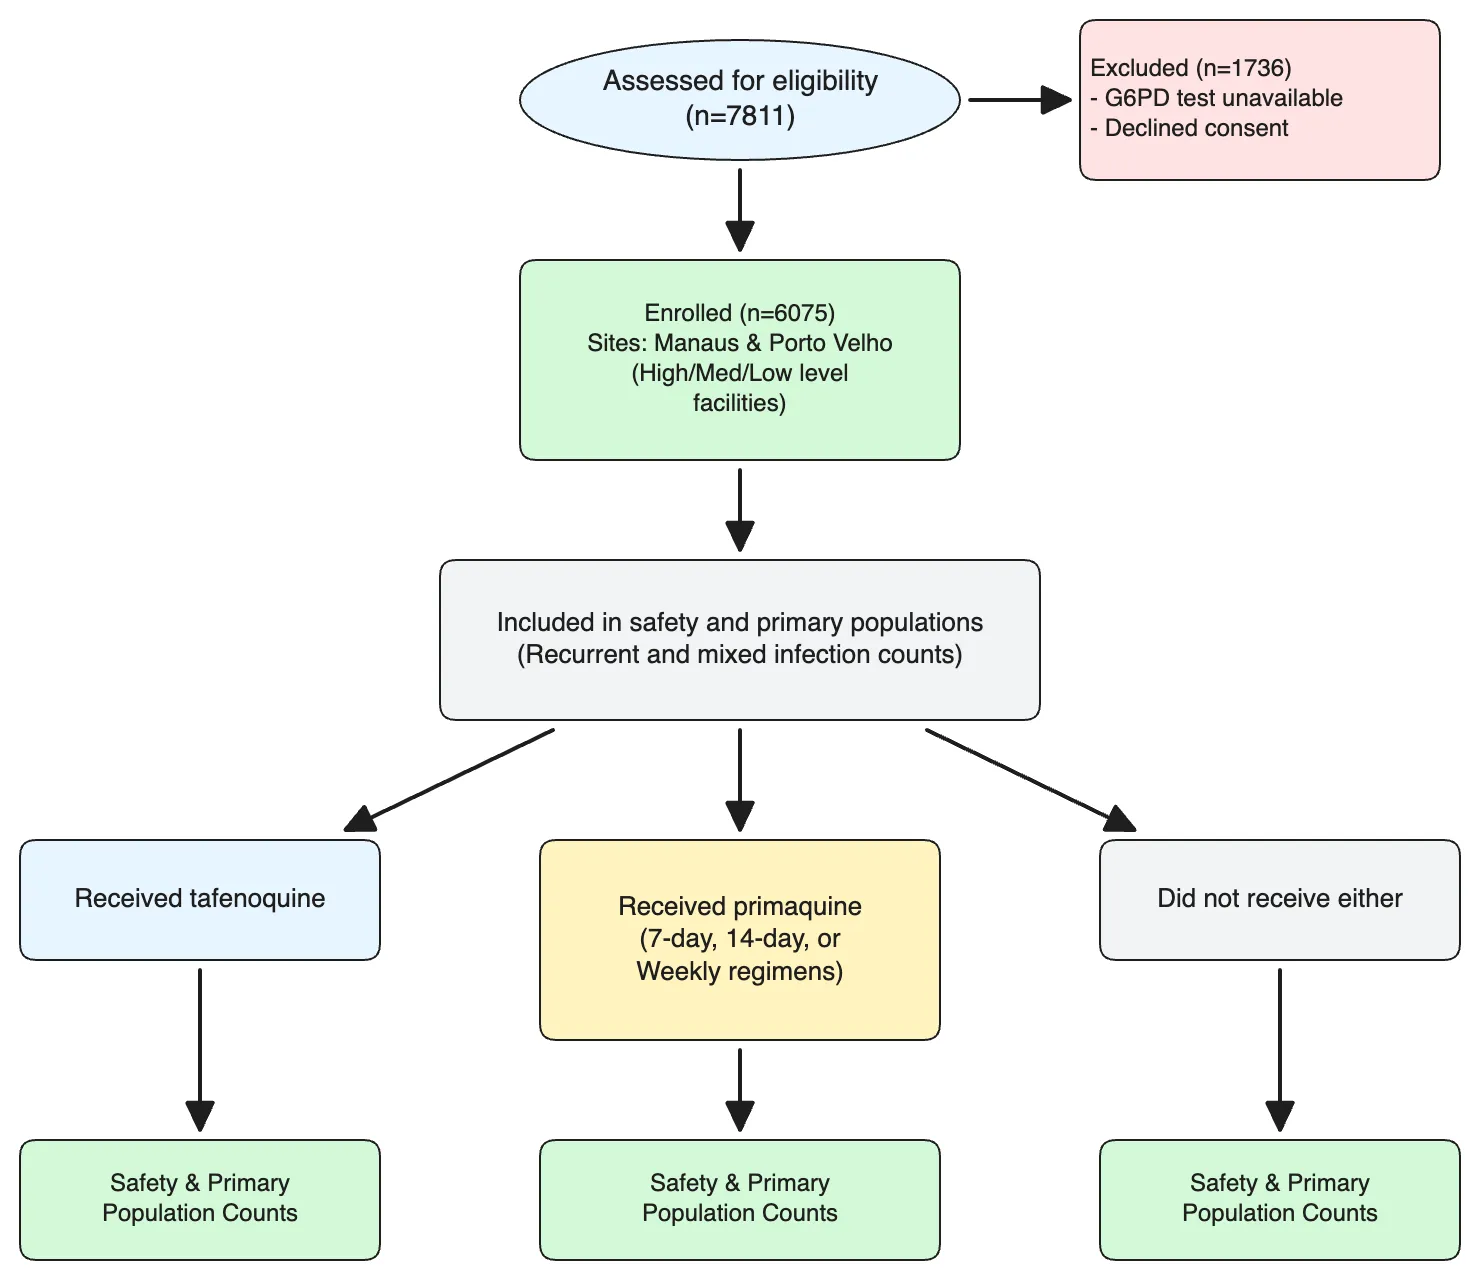
A top-down allocation flowchart for a retrospective antimalarial study. Start with "Assessed for eligibility (n=7811)". A side arrow branches right to "Excluded (n=1736)" with two sub-reasons (G6PD test unavailable, declined consent). The spine continues to "Enrolled (n=6075)", with small notes splitting enrolment across two sites (Manaus and Porto Velho, each further divided into high/medium-level and low-level health facilities). The next node is "Included in safety and primary populations", annotated with recurrent and mixed infection counts. From there, three parallel arrows branch into treatment groups: "Received tafenoquine", "Received primaquine", and "Did not receive either". The primaquine branch sub-splits into three regimens (7-day, 14-day, weekly). Each terminal group ends in a box summarising safety and primary-population counts. Layout and composition are up to the agent. Keep the three treatment branches clearly parallel. don't use mermaid
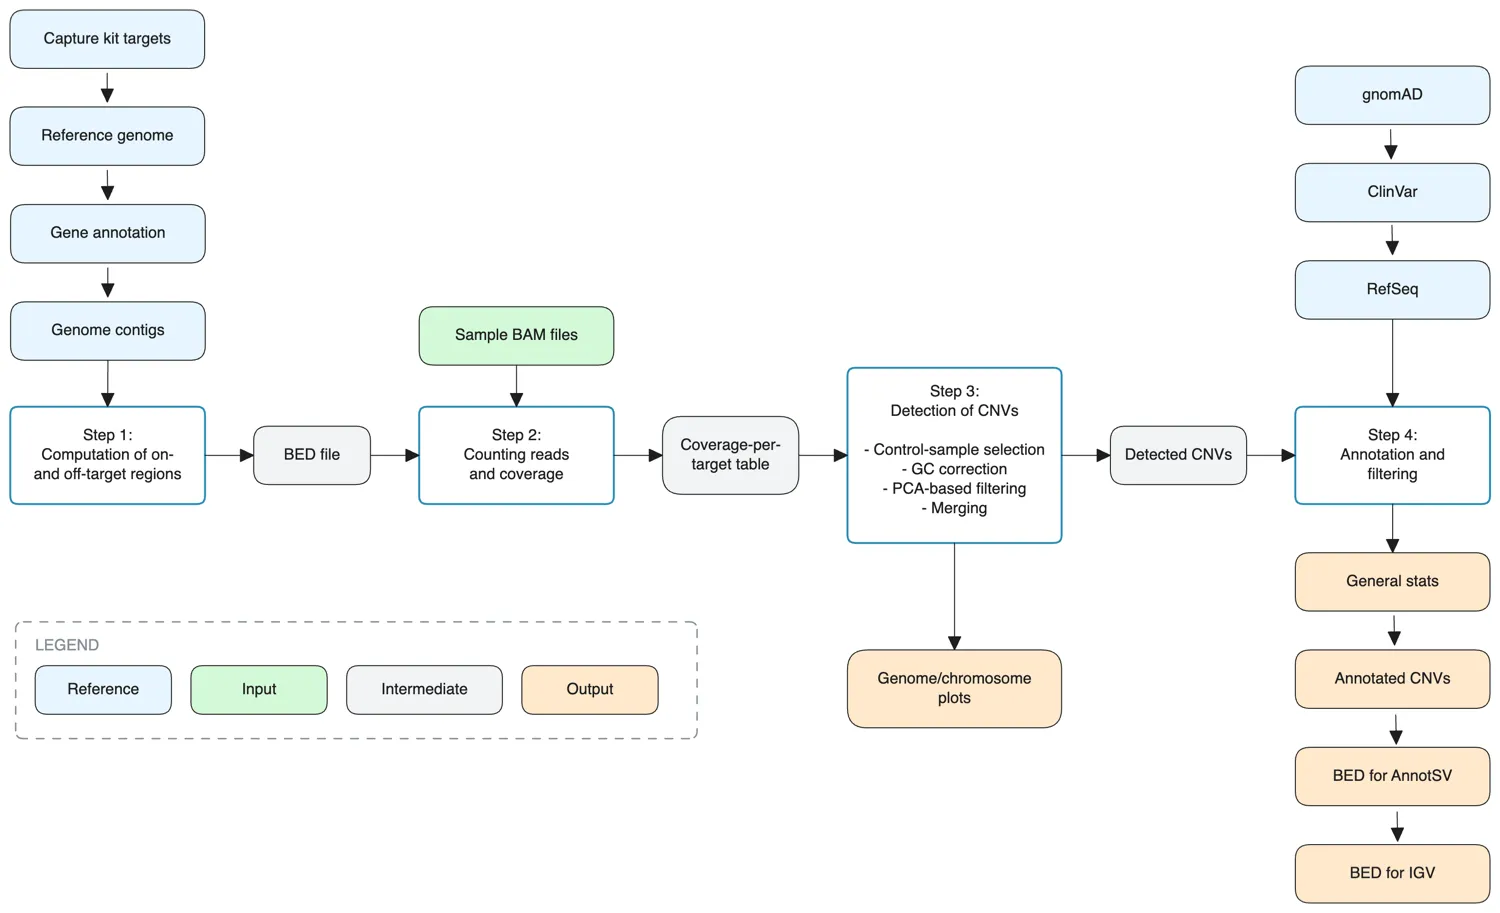
A four-step copy-number variant detection pipeline that distinguishes reference files, input files, intermediate files, and outputs. Step 1 "Computation of on- and off-target regions" takes four reference inputs (capture kit targets, reference genome, gene annotation, genome contigs) and emits a BED file. Step 2 "Counting reads and coverage" consumes that BED file plus sample BAM files and produces a coverage-per-target table. Step 3 "Detection of CNVs" runs control-sample selection, GC correction, PCA-based filtering, and merging, emitting "Detected CNVs" and "Genome/chromosome plots". Step 4 "Annotation and filtering" joins the detected CNVs with gnomAD, ClinVar, and RefSeq annotations, yielding general stats, annotated CNVs, and BED files for AnnotSV and IGV. A small legend distinguishes reference, input, intermediate, and output node types. use template 20399 don't use mermaid
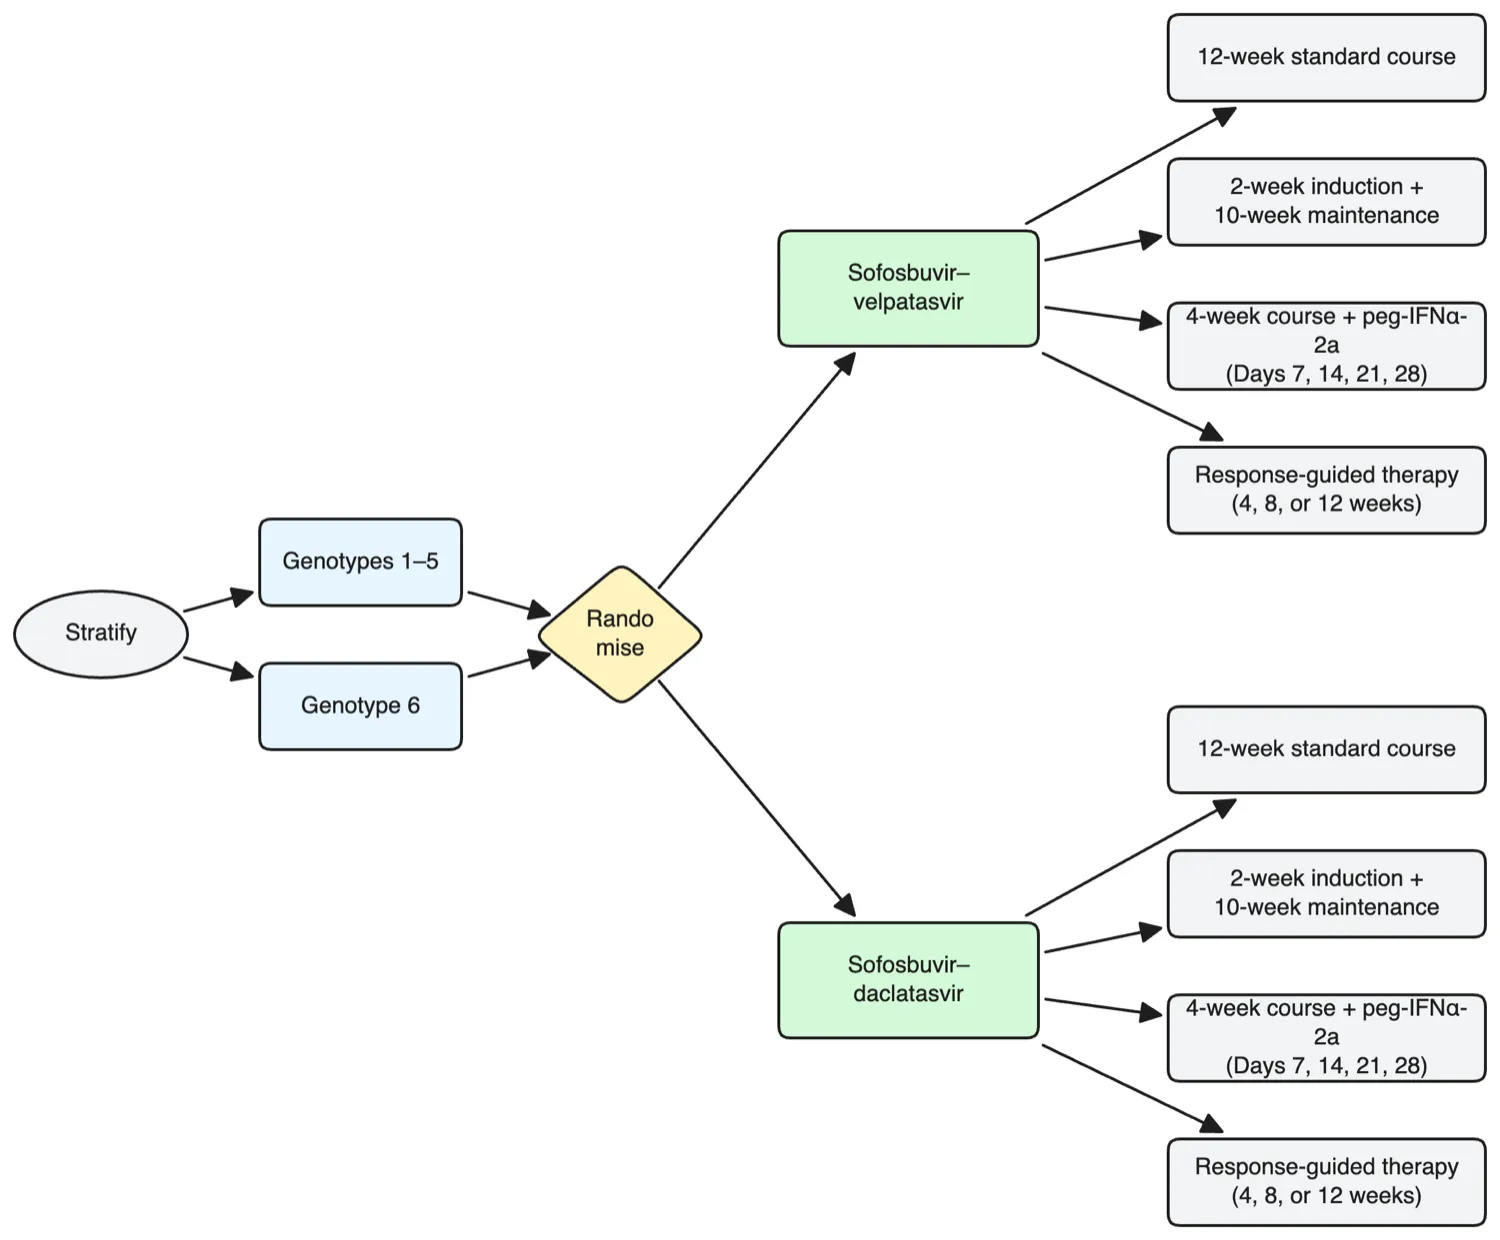
A left-to-right allocation diagram for a factorial randomised HCV trial. The spine begins at "Stratify", which branches into two genotype groups: "Genotypes 1–5" and "Genotype 6". Both feed into a single "Randomise" node. From randomisation, two parallel drug-pair labels sit on the left side: "Sofosbuvir–velpatasvir" and "Sofosbuvir–daclatasvir". Each pair fans out to the right into four treatment-duration arms: twelve-week standard course, two-week induction plus ten-week maintenance, four-week course plus pegylated interferon alfa-2a on days 7, 14, 21, 28, and a response-guided therapy arm whose duration (four, eight, or twelve weeks) is determined by day-7 viral load. The final eight arms form two horizontally aligned stacks, with the velpatasvir arms above and the daclatasvir arms below. Layout and composition are up to the agent. Keep the two drug-pair stacks clearly parallel. don't use mermaid
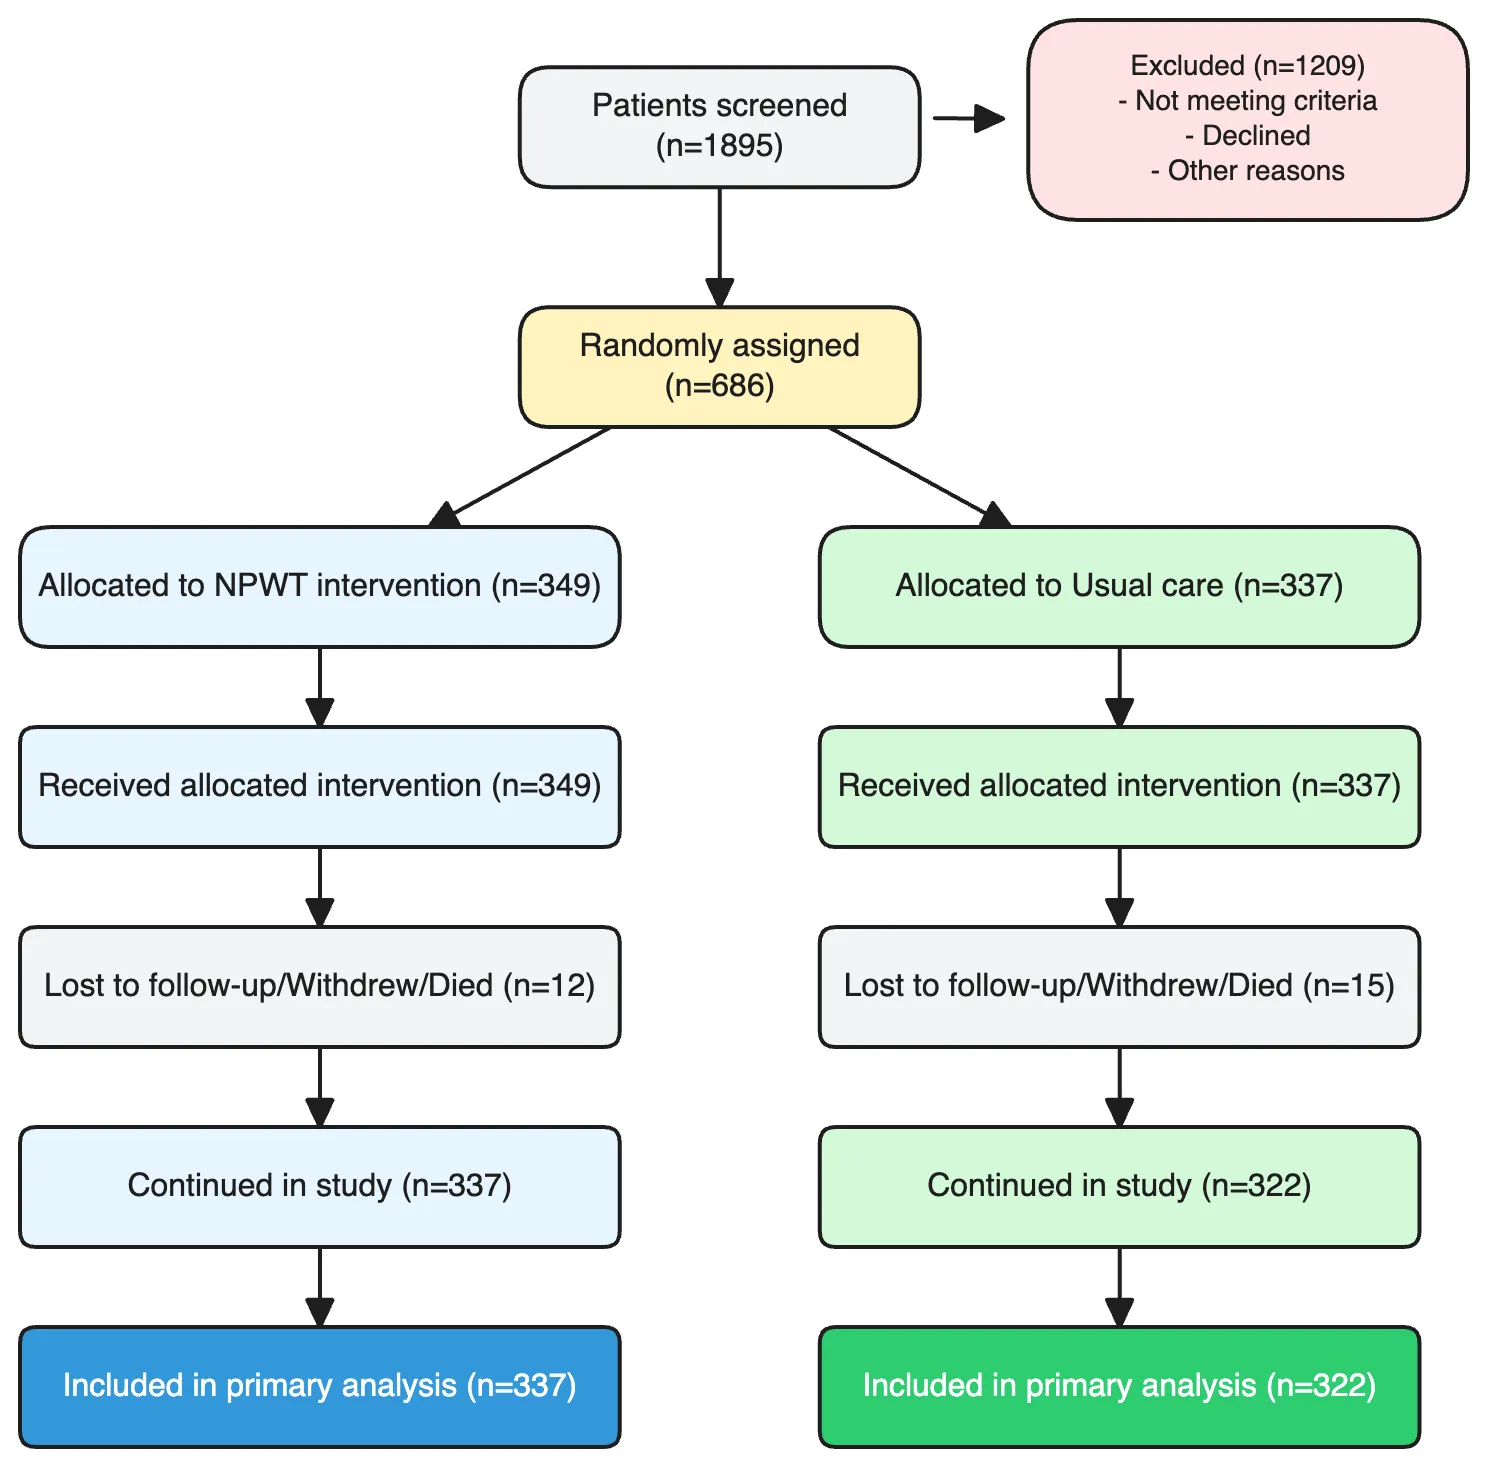
A CONSORT diagram tracking participants through a randomised wound-care trial. Start at the top with a node "Patients screened (n=1895)". An arrow drops down to a main spine; a side arrow branches right into an "Excluded (n=1209)" box that lists ineligibility reasons (not meeting age, wound, or consent criteria) and non-randomised cases. The spine continues to "Randomly assigned (n=686)". From there, two parallel branches split left and right into "NPWT intervention (n=349)" and "Usual care (n=337)". Each branch flows down through its own "Received intervention", "Withdrew or died during follow-up", "Continued in study", and finally "Included in primary analysis" boxes, with small side-notes for dropouts. Layout, spacing, and composition are up to the agent. Keep the two branches visually symmetric and the exclusion note clearly offset from the main spine. don't use mermaid
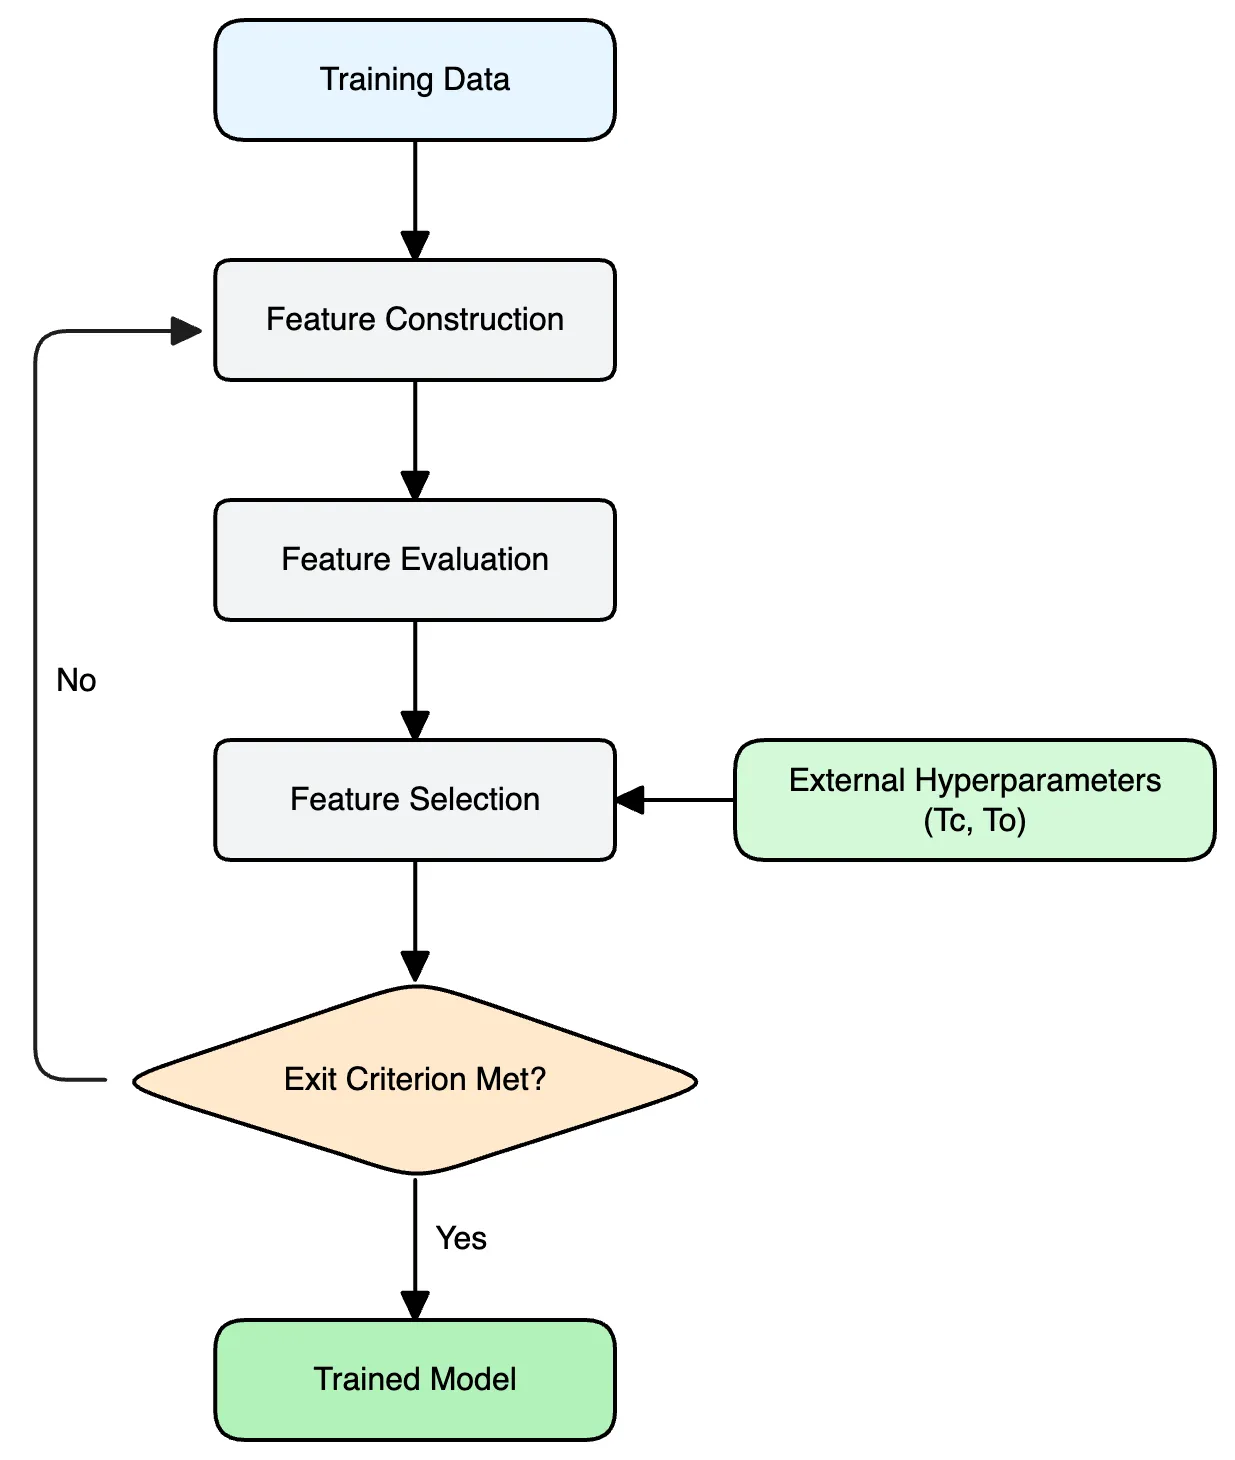
A machine-learning feature engineering pipeline with a feedback loop. The flow starts from training data, goes through three sequential processing steps — feature construction, feature evaluation, and feature selection — then hits a decision node that checks whether an exit criterion is met. If yes, the pipeline emits a trained model. If not, it loops back to feature construction. The selection step also accepts two external hyperparameters (e.g. `Tc`, `To`) fed in from the side. Layout, colors, and spacing are up to the agent. Keep it clean, readable, and visually balanced. use template 80332 don't use mermaid
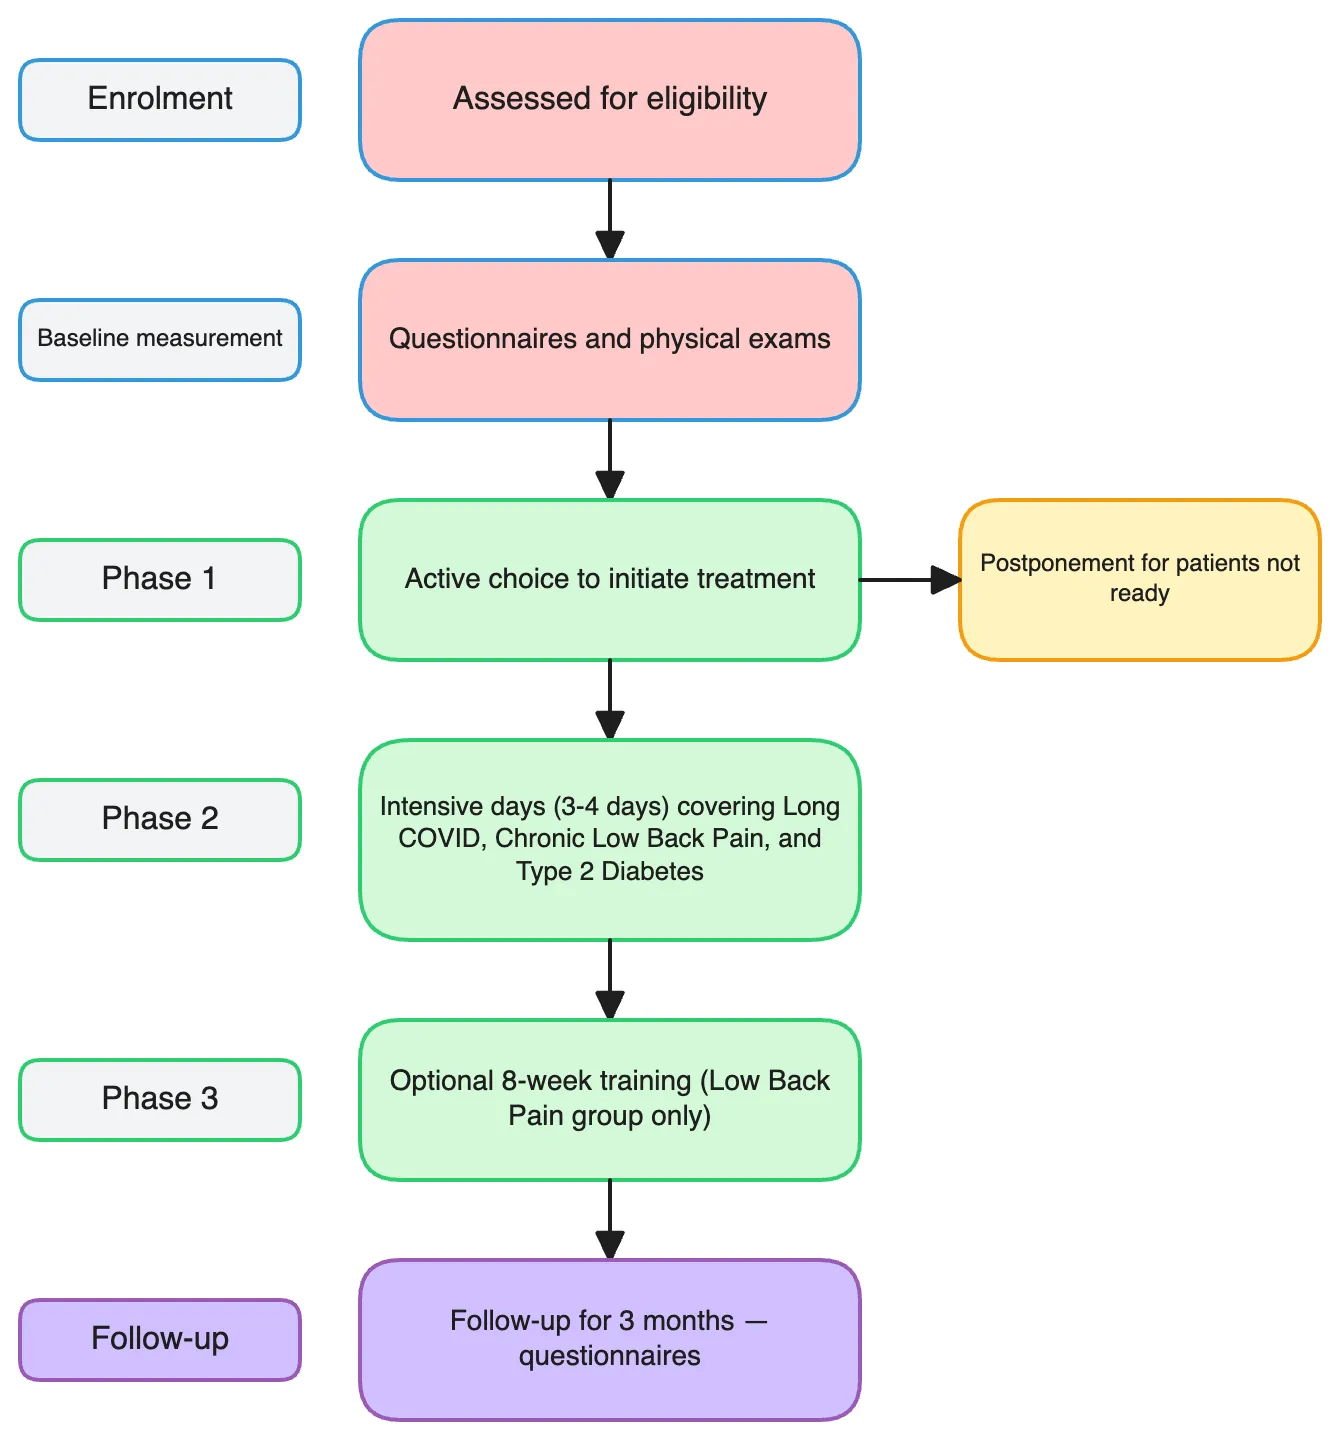
A vertical study-design flowchart for a pilot rehabilitation trial. The spine moves top-to-bottom through five labelled phases. "Enrolment" leads to "Assessed for eligibility", which feeds into "Baseline measurement" (questionnaires and physical exams). "Phase 1 — Preparing for change" captures an active choice to initiate treatment, with a small side branch for "Postponement for patients not ready". "Phase 2 — Concentrated group intervention" runs three or four intensive days covering long COVID, chronic low back pain, and type 2 diabetes cohorts. "Phase 3 — Integrating change into everyday life" notes optional eight-week training for the low-back-pain group. The spine ends at "Follow-up for 3 months — questionnaires". Each phase label sits in a small tag box next to its main step. Layout and composition are up to the agent. Keep the phase tags visually aligned with their main nodes. don't use mermaid
Flowchart types FigCanvas can generate
Build scientific flowcharts for research workflows, experimental design, study communication, and process-based scientific diagrams.
Experimental Workflows
Create scientific flowcharts for experimental protocols, sample handling, multi-stage procedures, and lab process sequences.
Study Design Diagrams
Visualize cohort design, randomization, treatment arms, data collection stages, and endpoint definitions for papers and grant proposals.
Analysis Pipelines
Map bioinformatics, statistical, and machine learning pipelines from raw data to results with clear, structured scientific flowcharts.
Lab Process Flowcharts
Turn lab protocols — Western blot, PCR, ELISA, CRISPR screens — into step-by-step visual schematics for methods sections.
Clinical Flow Diagrams
Generate CONSORT-style diagrams for clinical trials, screening flows, randomization schemes, and follow-up timelines.
Research Process Visuals
Build research process flowcharts for grant applications, project overviews, study rationale, and scientific communication.
How FigCanvas works
Go from prompt to editable scientific flowchart in three steps.
Describe your workflow
Write a plain-language prompt describing the experimental workflow, study design, research process, or analysis pipeline you want to visualize.
Generate a structured flowchart
FigCanvas turns your prompt into a clear scientific flowchart with ordered steps, labeled stages, and research-focused visual structure.
Refine, vectorize, and export
Convert the result into an editable vector flowchart, refine the layout, and export your diagram as SVG, PNG, or PDF.
Why FigCanvas for scientific flowcharts
Designed for research workflows
Create scientific flowcharts for experimental workflows, study design diagrams, and analysis pipelines with layout and structure tuned for research communication.
Clear step-by-step structure
Organize complex methods, stages, and process logic into a clear visual sequence that follows journal figure conventions.
Editable as vector graphics
Convert generated flowcharts into editable vector graphics for easier refinement, label updates, and layout adjustments before finalizing.
Export-ready for research communication
Export scientific flowcharts as SVG, PNG, or PDF for manuscripts, posters, presentations, grant slides, and other research workflows.
Scientific flowcharts for research workflows
Use FigCanvas to create flowcharts for experiments, study design, lab processes, analysis pipelines, and scientific communication.
For experimental design
Create scientific flowcharts that explain experimental setup, sample flow, treatment order, and downstream analysis.
For study design and grant planning
Visualize cohort design, randomization, research timelines, and procedural logic in funding applications and project plans.
For methods and analysis pipelines
Turn laboratory methods, computational workflows, and analysis pipelines into structured scientific diagrams.
For posters, slides, and team communication
Create clear flowcharts for presentations, posters, lab meetings, and collaborator communication.
Scientific Flowchart Maker FAQs
A scientific flowchart is a structured visual diagram used to explain experimental workflows, study design, lab processes, analysis pipelines, and other research procedures.
FigCanvas can help create scientific flowcharts for experiments, study design diagrams, analysis pipelines, clinical flows, lab workflows, and research process visuals.
Yes. FigCanvas can generate flowcharts for experimental workflows, protocol steps, sample handling, and multi-stage research procedures.
Yes. You can use FigCanvas to visualize cohort design, treatment arms, screening flow, timelines, and other study design elements.
Yes. FigCanvas can convert generated flowcharts into editable vector graphics so you can refine labels, layout, and structure before export.
You can export scientific flowcharts in SVG, PNG, or PDF format for papers, posters, slides, and research communication workflows.
Create scientific flowcharts from text in minutes
Paste your methods section or protocol and generate editable flowcharts for experimental workflows, CONSORT diagrams, and bioinformatics pipelines.