Volcano Plot Generator
for RNA-seq & Proteomics
Generate publication-ready volcano plots from RNA-seq, proteomics, and GWAS data. Custom thresholds, gene labels, and color schemes — no R or Python required.
Try a sample dataset or upload your own
Upload differential expression data
Drag and drop your DESeq2, edgeR, limma, proteomics, or GWAS file here, or click to choose a file.
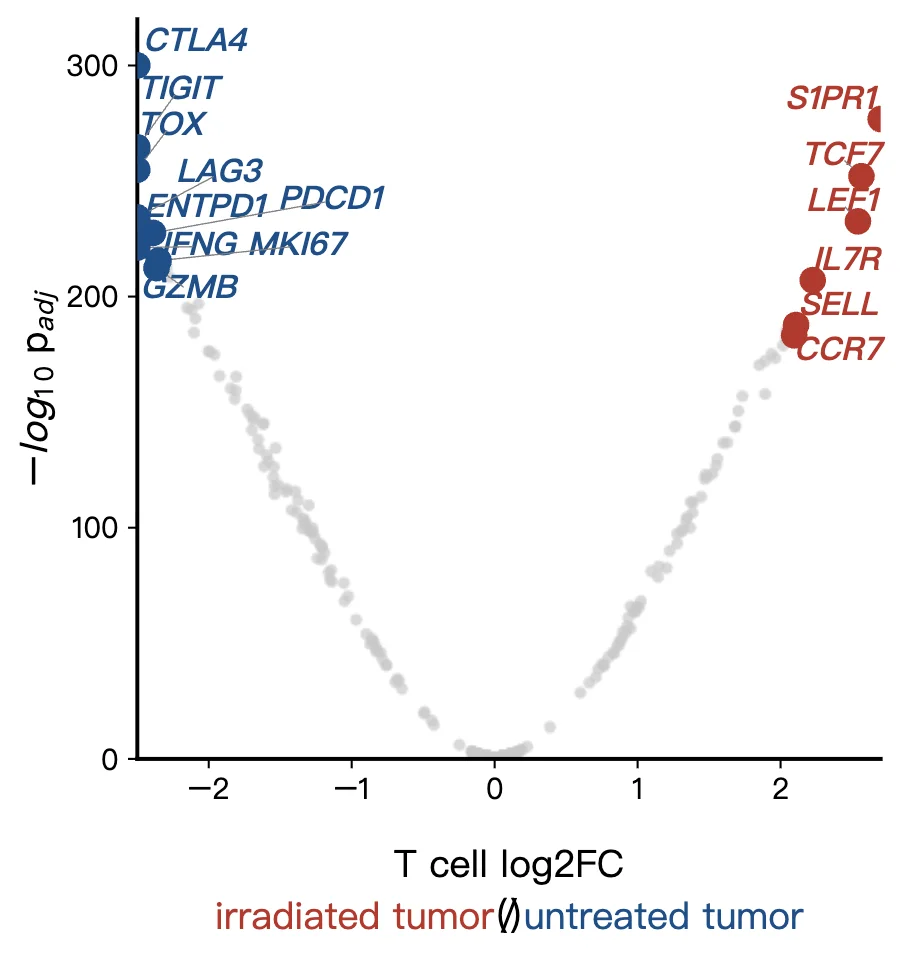
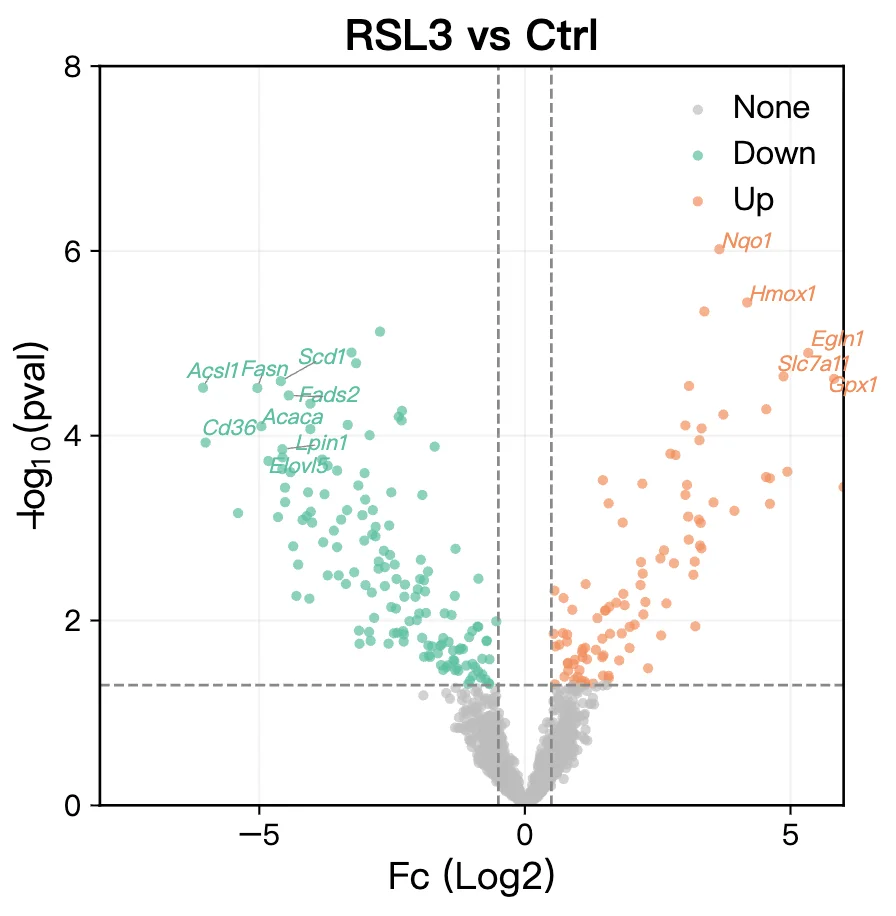
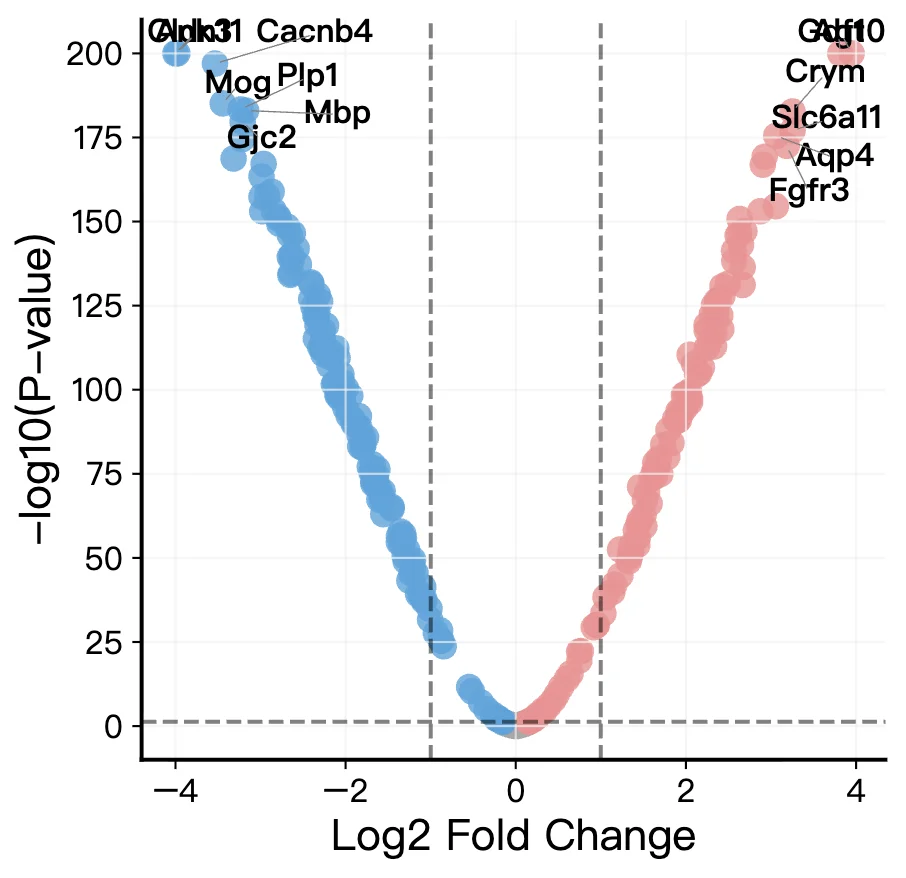
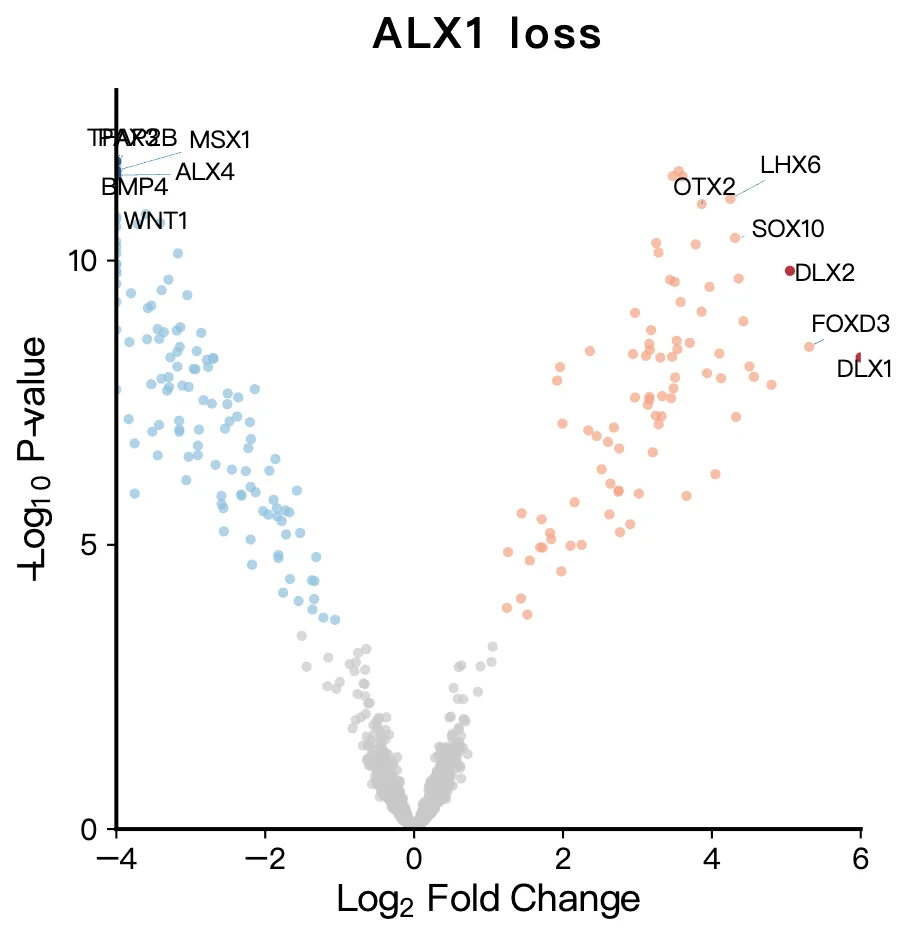
Volcano plot examples generated from research data
What researchers uploaded → what FigCanvas generated.

Volcano plot types FigCanvas can generate
From RNA-seq differential expression to GWAS results, FigCanvas handles the full range of volcano plot types used in research publications.
RNA-seq Volcano Plots
Visualize differential expression results from DESeq2, edgeR, or limma. Annotate key genes, set custom fold change and FDR thresholds.
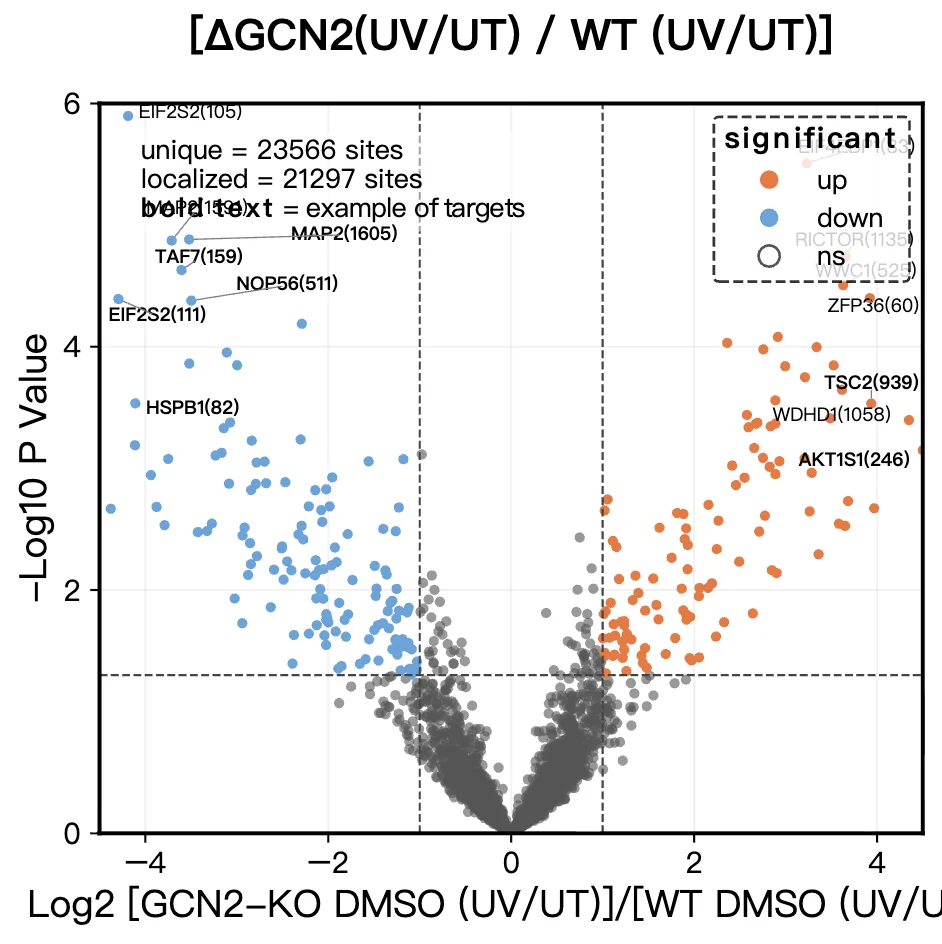
Proteomics Volcano Plots
Create volcano plots from SILAC, TMT, or label-free quantification data. Label top hits by significance, pathway, or custom gene list.
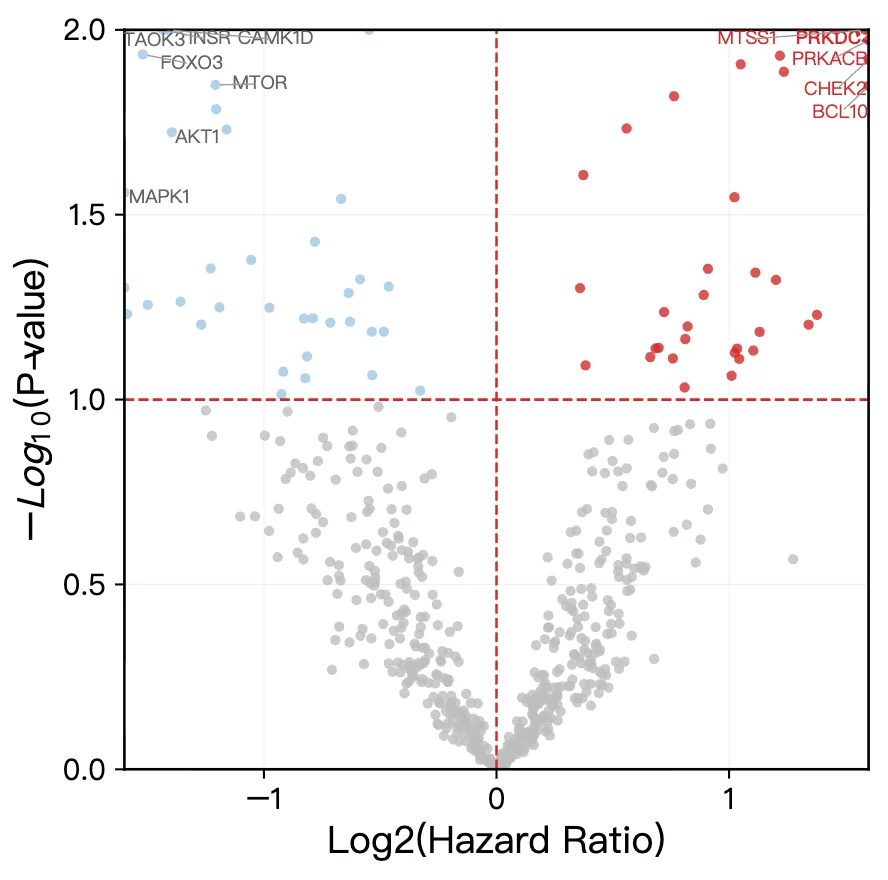
GWAS Visualization
Plot genome-wide association results with significance thresholds, SNP annotations, and chromosome-based color coding.
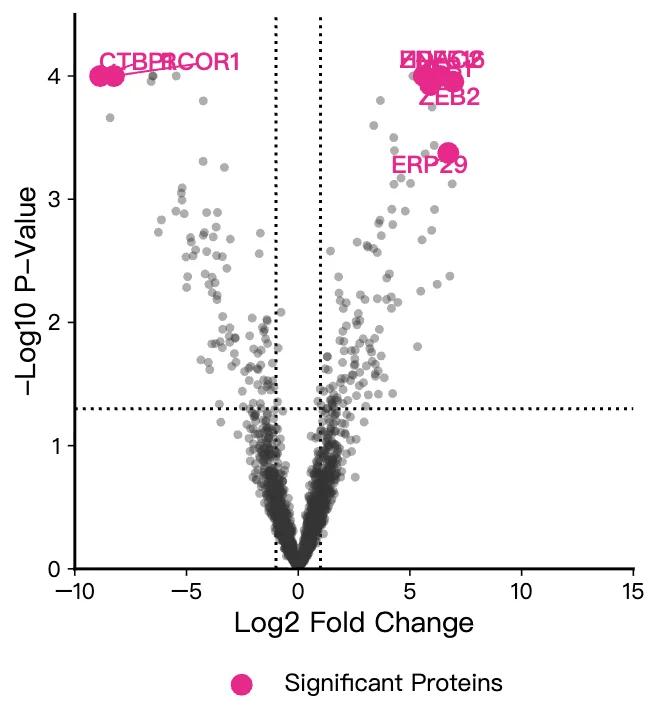
Metabolomics Volcano Plots
Generate volcano plots from metabolomics datasets with pathway-level annotations and support for positive and negative ion mode data.
Multi-condition Comparisons
Compare differentially expressed features across multiple conditions or timepoints with consistent formatting and shared axis scales.
Custom Threshold and Label Plots
Set custom significance cutoffs, highlight specific genes or proteins by name, and choose color schemes suited for publication and accessibility.
How FigCanvas works
Go from differential expression data to a publication-ready volcano plot in four steps.
Upload differential expression data
Upload your RNA-seq, proteomics, or other differential analysis results in CSV or Excel format. FigCanvas auto-detects key columns such as log2 fold change and adjusted p-value.
Analyze and recommend a setup
FigCanvas inspects your data structure and identifies the most suitable volcano plot workflow, including thresholds, labeling strategy, and visual emphasis.
Generate a publication-ready plot
Using research-focused visual defaults, FigCanvas creates a clean volcano plot with balanced color, clear thresholds, and journal-style presentation.
Refine, vectorize, and export
Fine-tune labels and styling, convert the figure into an editable vector graphic if needed, and export as SVG, PDF, or PNG.
Why FigCanvas for publication-ready volcano plots
No R or Python required
Skip the ggplot2 setup, package installation, and debugging. Upload your data and FigCanvas generates the volcano plot directly — the same quality you would get from EnhancedVolcano, without a single line of code.
Publication-ready output by default
Default styling follows common journal figure conventions, with clean backgrounds, balanced color emphasis, clear significance thresholds, and readable axis labeling.
Smart gene label positioning
Annotate specific genes and let FigCanvas place labels automatically to reduce overlap and improve readability in dense volcano plots.
Flexible export for papers, posters, slides
Export your volcano plot as SVG, PNG, or PDF for manuscripts, posters, presentations, and journal submission workflows. SVG output also makes it easier to refine the figure in vector editing tools.
Volcano plots for research workflows
Use FigCanvas to create volcano plots for differential expression analysis, publication figures, posters, and scientific presentations.
For RNA-seq studies
Create volcano plots from DESeq2, edgeR, or limma results. Highlight significant genes, apply fold change and FDR thresholds, and prepare figures for differential expression analysis.
For proteomics and metabolomics
Generate volcano plots from differential protein or metabolite analysis, annotate top hits, and visualize significance with publication-ready styling.
For multi-omics and comparative analysis
Use volcano plots to compare conditions, highlight significant features, and visualize differential signals across multiple omics workflows.
For manuscripts and posters
Export publication-ready volcano plots for journal figures, conference posters, slides, and other research communication workflows.
Volcano Plot Generator FAQs
A volcano plot is a scatter plot used in genomics and proteomics to visualize differential expression results. The x-axis shows log2 fold change and the y-axis shows -log10 adjusted p-value. Significantly differentially expressed genes appear in the upper corners, forming a volcano shape.
FigCanvas accepts CSV or Excel files with columns for gene name, log2FoldChange (or logFC), and adjusted p-value (padj, adj.P.Val, or FDR). Output from DESeq2, edgeR, limma, and most other differential expression tools is supported directly.
In R (ggplot2, EnhancedVolcano) or Python (matplotlib), you write code, debug it, and format the plot manually — typically taking 30–60 minutes. FigCanvas generates the same quality plot in under 60 seconds with zero code. You can then edit colors, labels, and thresholds interactively.
Yes. You can specify a list of gene names to label directly on the plot. FigCanvas automatically positions labels to avoid overlap, following the same conventions used in EnhancedVolcano and ggrepel.
Yes. FigCanvas exports at 300 DPI with standard publication fonts. The default aesthetic matches what you would see in a Nature or Cell paper. SVG output is fully editable in Adobe Illustrator or Inkscape.
Yes. FigCanvas supports volcano plots for proteomics (SILAC, TMT, LFQ), GWAS results, metabolomics, and other datasets that produce fold change and significance values.
Generate publication-ready volcano plots from your data
Upload DESeq2, edgeR, or limma results and create volcano plots with gene labels, significance thresholds, and journal-ready styling — no coding required.