
AI Graphical Abstract Maker
for Research Papers
Turn your paper into a journal-ready graphical abstract from a plain-language description. Clear layouts for Cell, Nature, and Elsevier submissions — no design software required.
Try a sample prompt or write your own
Graphical abstract examples generated from a description
What researchers described → what FigCanvas generated. Click any card to copy its prompt.
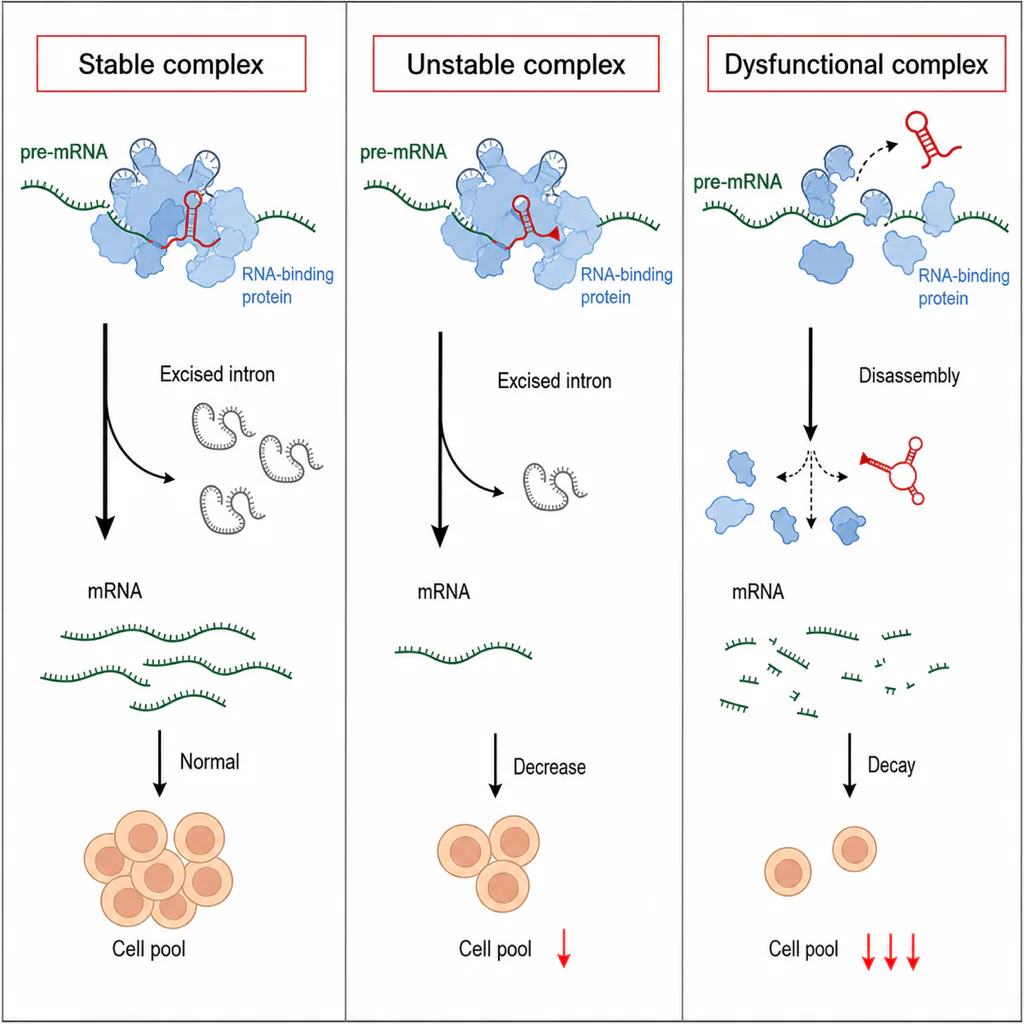
A graphical abstract for a cell biology paper. Show a single molecular mechanism in three connected stages arranged left to right: a receptor at the cell membrane binding its ligand, a downstream signaling cascade inside the cytoplasm, and a transcriptional response in the nucleus. Use one clear arrow between each stage and a short label under each. Style: flat, editorial, Nature-journal aesthetic, generous whitespace, one accent color. Square 1:1 composition suitable for a journal graphical abstract.
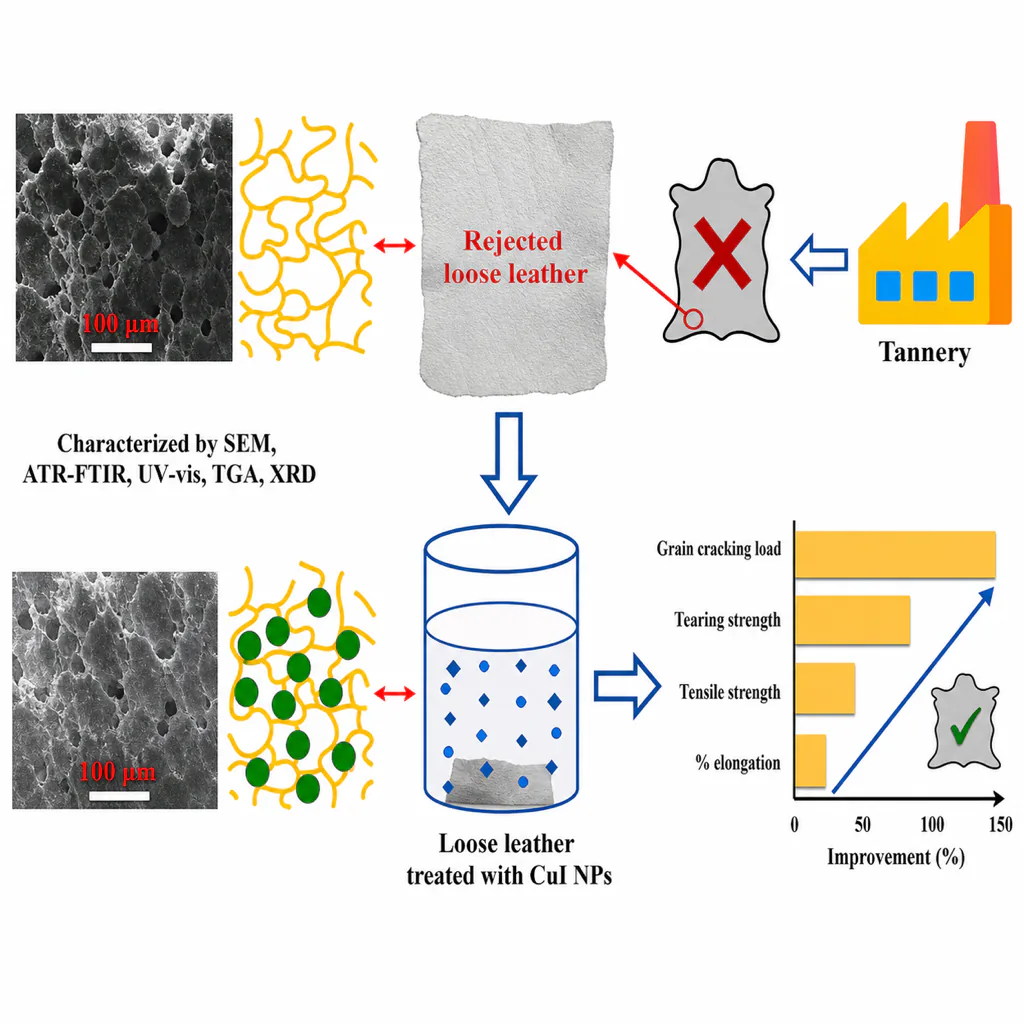
A graphical abstract for a materials science paper. Left: the synthesized material shown as a labeled cross-section or nanostructure. Center: the key property or mechanism visualized simply (for example a charge-transport arrow or a stress-strain hint). Right: the application, drawn as a small device or use-case icon. Arrows connect material → property → application. Style: flat, editorial, journal-ready, one accent color, square 1:1 composition.
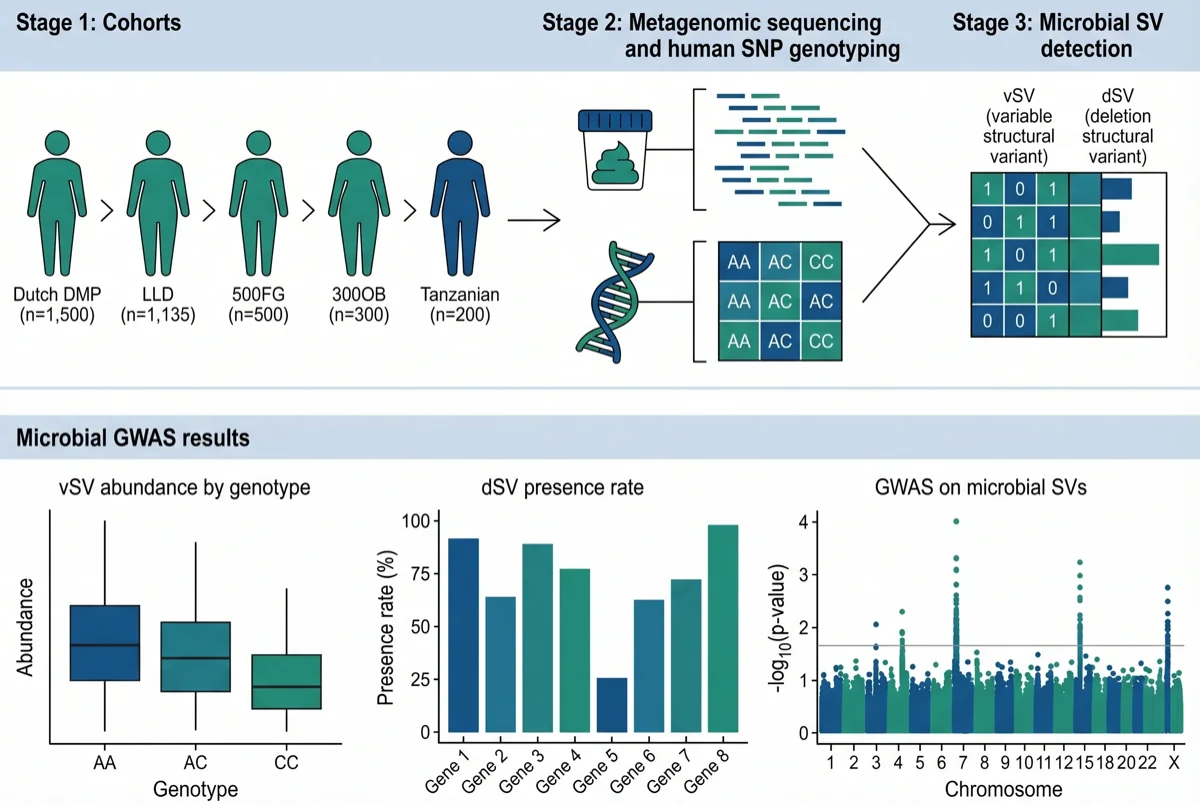
A graphical abstract for a population study. Top row: the study pipeline in three stages — cohorts, sequencing/genotyping, and variant detection. Bottom row: two or three result panels (a boxplot, a bar chart, and a Manhattan-style plot). Keep labels short and the layout gridded. Style: flat, editorial, Nature-journal aesthetic, restrained palette, square 1:1 composition.
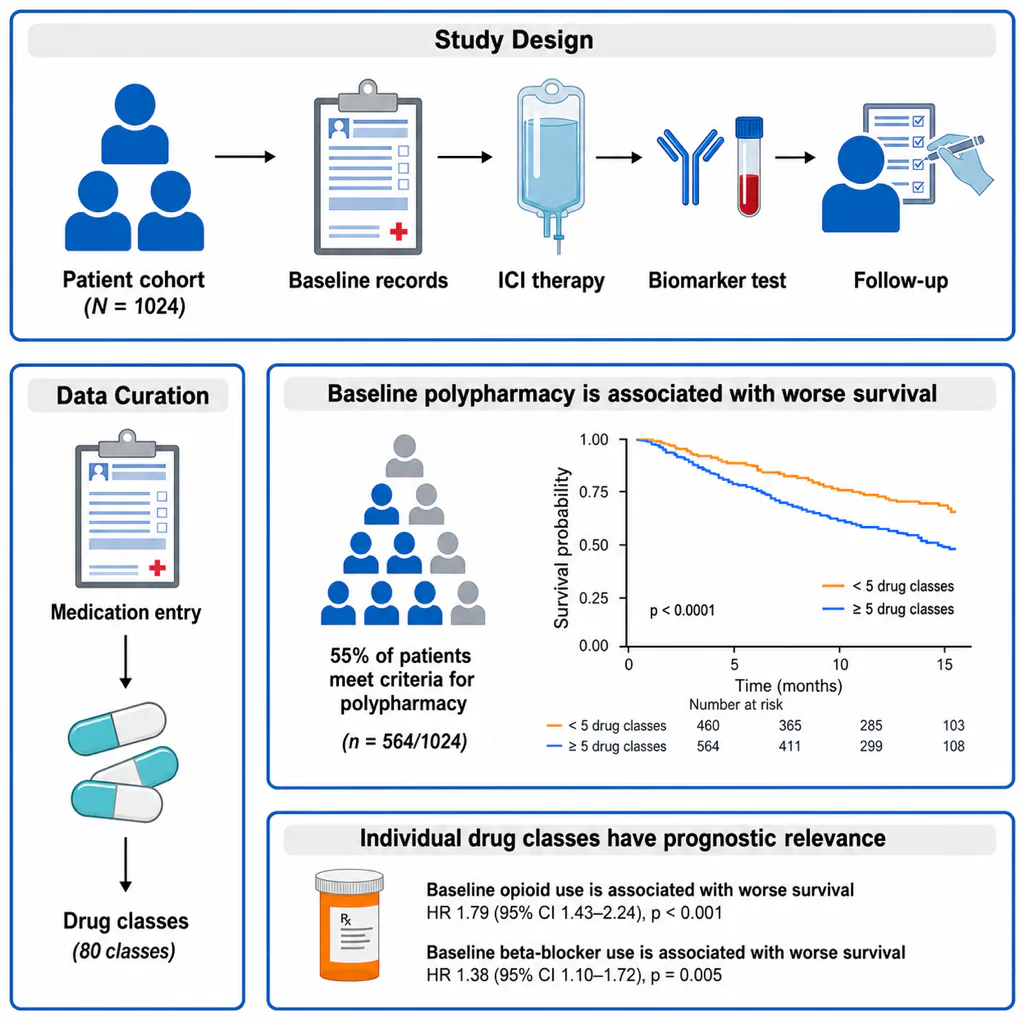
A graphical abstract for a clinical cohort study. Left panel: a patient cohort represented by a grid of human icons split into two groups. Middle panel: the intervention and follow-up timeline drawn as a horizontal arrow with two or three milestones. Right panel: the primary outcome shown as a simple bar or Kaplan-Meier-style curve comparing the two groups. Keep it clean with short labels. Style: flat, editorial, journal-ready, one accent color, square 1:1 composition.
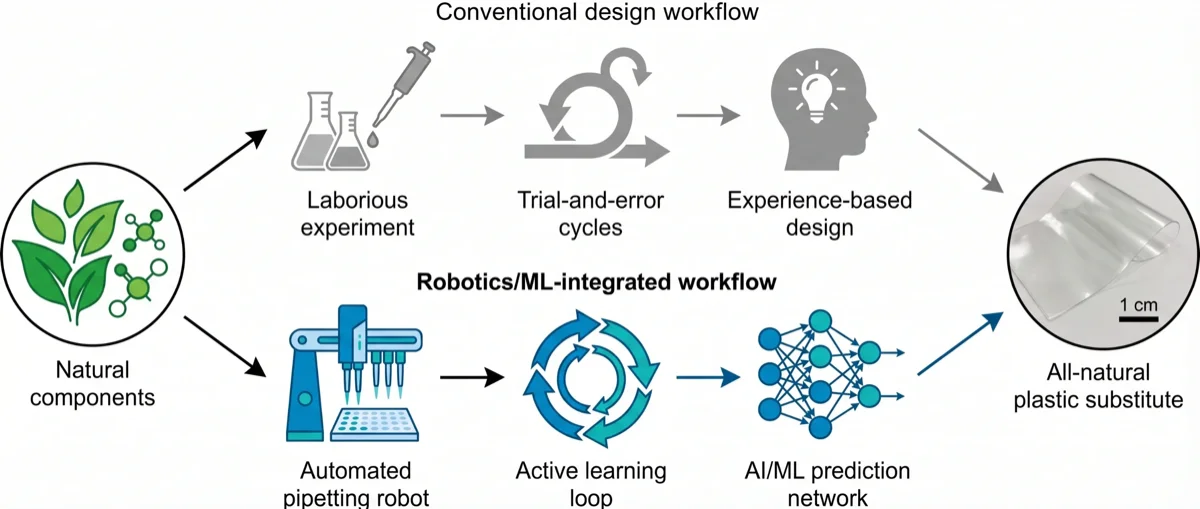
A graphical abstract contrasting a conventional workflow with an AI/robotics workflow. Draw two parallel horizontal paths from the same starting point to the same end product: the top path greyed out (slow, manual, trial-and-error), the bottom path in a bold accent (automated pipeline with an active-learning loop). Arrows flow along each path. Style: flat, editorial, journal-ready, square 1:1 composition.
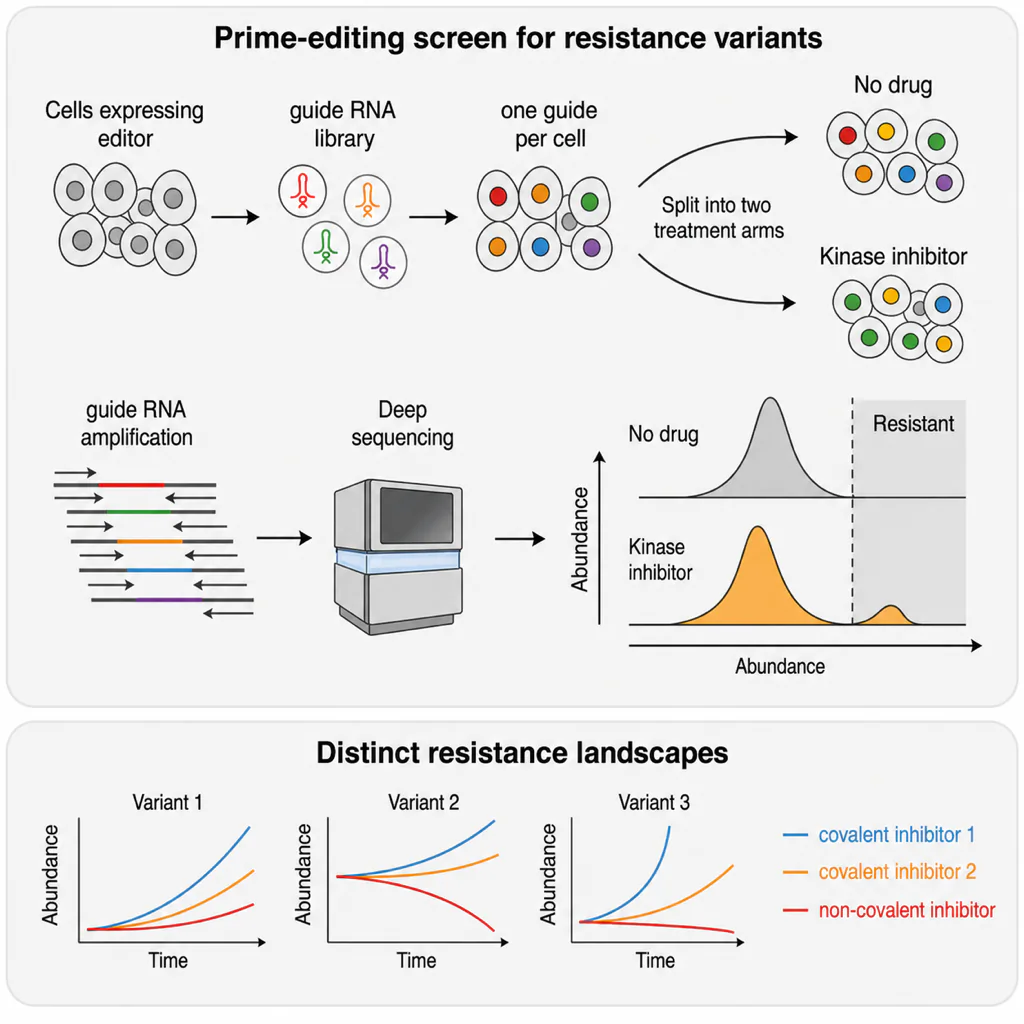
A graphical abstract for a functional genomics paper. Show the workflow left to right: a DNA/sequencing icon feeding into a screening step, then a hit-selection panel with a small heatmap, and finally a validated phenotype in a cell or organism. Connect the steps with arrows and add short captions. Style: flat, editorial, Nature-journal aesthetic, restrained palette, square 1:1 composition for a graphical abstract.
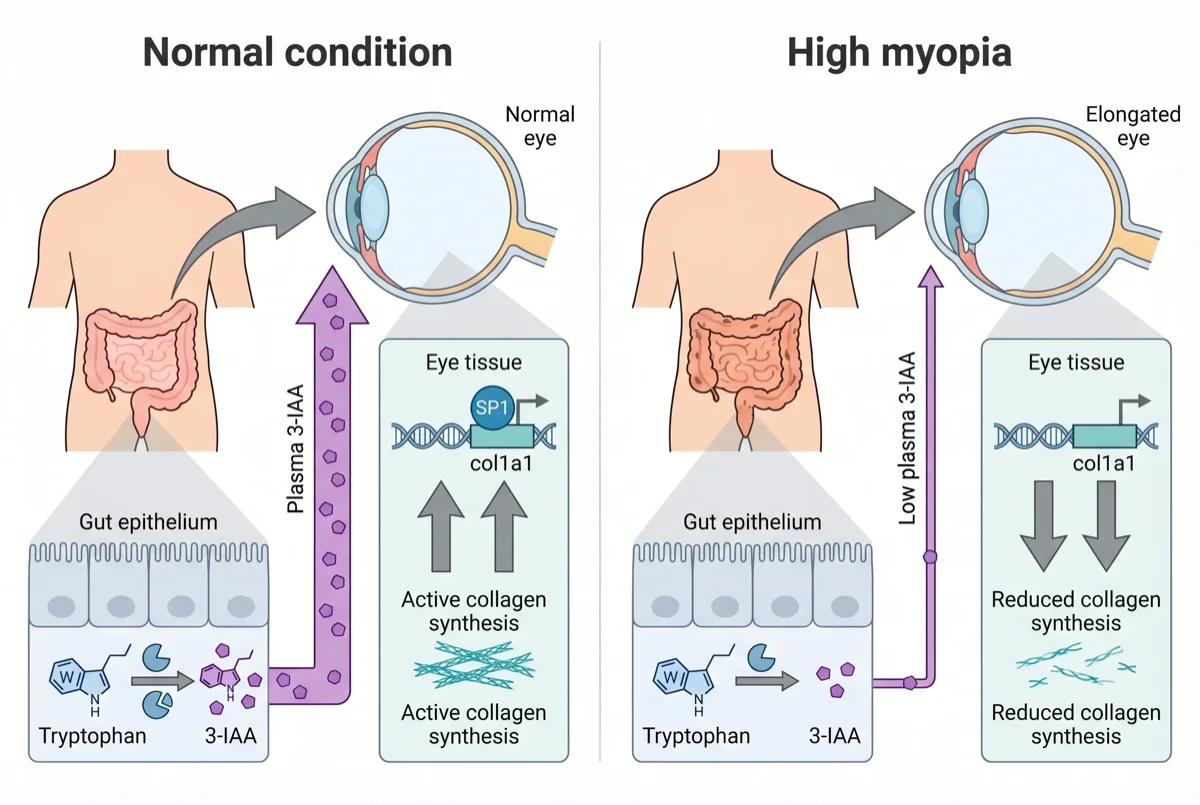
A graphical abstract showing a body-axis biological pathway. Depict how an organ-derived signal travels to a distant target organ and changes its phenotype, using two connected panels: the source organ with its metabolic output on the bottom, and the affected target organ on top, joined by a vertical arrow. Show a normal state versus an altered state side by side. Style: flat, editorial, Nature-journal aesthetic, square 1:1 composition.
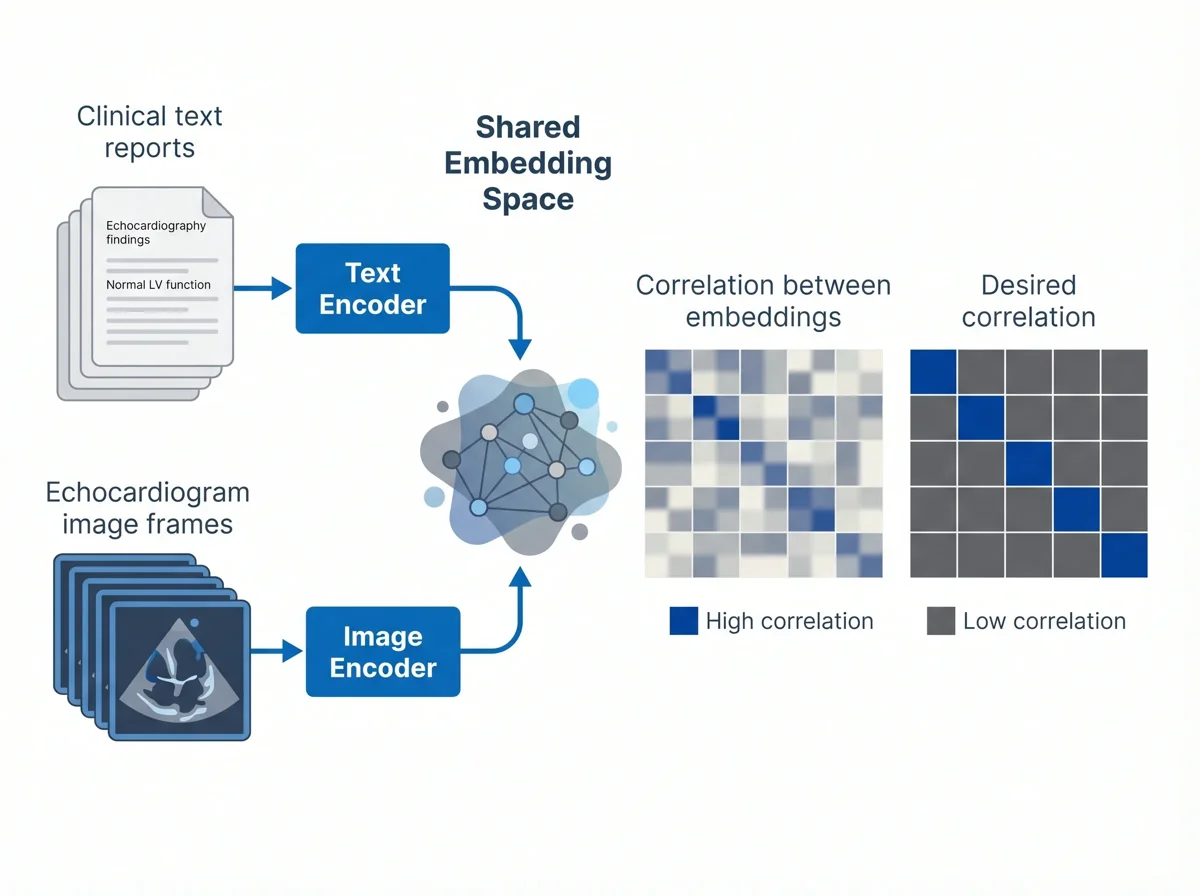
A graphical abstract for a machine learning method paper. Left: two input modalities (a stack of text records and a stack of images) each entering an encoder. Center: a shared embedding space where the two modalities align. Right: two small similarity matrices showing the current versus desired alignment. Style: flat, editorial, journal-ready, one accent color, square 1:1 composition.
Graphical abstracts for every field
From molecular mechanisms to clinical trials, FigCanvas generates graphical abstracts across the disciplines and journal styles researchers publish in.
Cell & Molecular Biology
Summarize a mechanism, pathway, or regulatory story in a single figure — from receptor binding to phenotype, laid out for a journal cover.
Clinical & Translational
Communicate a trial design, cohort, or patient outcome with a clear population → intervention → result flow that reviewers grasp at a glance.
Genomics & Bioinformatics
Turn a sequencing-to-analysis pipeline into a compact visual: sample, method, and key result panels arranged in reading order.
Chemistry & Materials
Show a synthesis route, structure, or structure–property–application chain in the square format Cell and ACS journals expect.
Methods & Machine Learning
Explain a model, assay, or computational workflow as inputs, processing, and outputs — ideal for method and AI-in-science papers.
Any Field or Journal
Describe your study in plain language and generate a graphical abstract sized and styled for your target journal, whatever the discipline.
How FigCanvas works
Go from a plain-language summary to a submission-ready graphical abstract in four steps.
Describe your paper
Write a plain-language summary of your study — the question, the method, and the main finding. No layout or design vocabulary needed; a few sentences is enough.
Pick a layout and journal size
FigCanvas proposes a graphical abstract structure — left-to-right flow, problem–method–result, or a central mechanism — and sizes it for your target journal.
Generate the graphical abstract
Using journal-style visual defaults, FigCanvas produces a clean, single-panel graphical abstract with balanced color, clear arrows, and readable labels.
Refine, vectorize, and export
Adjust wording, icons, and layout on the canvas, convert the figure to editable vectors if needed, and export at 300 DPI as PNG, SVG, or PDF for submission.
Why FigCanvas for journal-ready graphical abstracts
Journal-ready by default
Graphical abstracts follow common submission conventions — square or wide formats, clean backgrounds, restrained color, and legible type at thumbnail size — so your figure passes the first editorial look.
No design software to learn
Skip Illustrator, PowerPoint, and icon libraries. Describe the story in words and FigCanvas handles composition, alignment, and color, leaving you to fine-tune the details.
From your science, not stock art
The figure is generated around your actual mechanism, workflow, or result rather than assembled from generic icons — so it communicates the specific contribution of your paper.
Editable and export-flexible
Every element stays editable on the canvas, and SVG export lets you refine the graphical abstract in vector tools before submitting to Cell, Nature, or an Elsevier journal.
Graphical abstracts for research workflows
Use FigCanvas to create graphical abstracts for journal submission, preprints, posters, talks, and grant applications.
For journal submission
Generate a graphical abstract that meets size, resolution, and style requirements for Cell, Nature, ACS, and Elsevier journals, and export it ready to upload.
For preprints and revisions
Draft a graphical abstract for bioRxiv or medRxiv, then quickly regenerate it as your figure or framing changes during peer review.
For talks and posters
Reuse the same visual summary as an opening slide or poster centerpiece, exported at high resolution for large-format printing.
For grants and social sharing
Turn a project into a single clear visual for grant applications, lab websites, and paper announcements on social media.
Graphical Abstract Maker FAQs
A graphical abstract is a single, self-explanatory figure that summarizes the main finding of a research paper. Many journals — including Cell, Nature portfolio titles, and most Elsevier journals — request one during submission so readers can grasp the study at a glance.
Describe your study in plain language — the question, method, and key result. FigCanvas proposes a layout, generates a journal-ready graphical abstract, and lets you refine the wording, icons, and colors on the canvas before exporting as PNG, SVG, or PDF.
Requirements vary by journal, but a square (1:1) or wide format at roughly 1200–1800 px on the longest side and 300 DPI is widely accepted. FigCanvas can size the figure for your target journal and exports at 300 DPI for print-quality submission.
No. FigCanvas handles composition, alignment, and color from your text description, so you do not need Illustrator, PowerPoint, or a separate icon library. You can still fine-tune every element on the canvas if you want precise control.
Yes. FigCanvas exports graphical abstracts as high-resolution PNG, editable SVG, and PDF. SVG output can be refined further in Adobe Illustrator or Inkscape before you submit.
Yes. Figures you generate are royalty-free and can be published in journals, posters, and presentations. You retain ownership of the graphical abstracts you create.
Make a journal-ready graphical abstract from your paper
Describe your study in a few sentences and create a graphical abstract with clear arrows, labels, and journal-ready styling — no design software required.