

Most readers will not start by reading your full paper.
They will scan the title, glance at the figures, and decide within seconds whether your study is worth opening. A graphical abstract gives your research one clear visual hook: what you studied, how you studied it, and what you found.
The challenge is that many graphical abstracts become either too crowded, too vague, or too decorative. Instead of helping readers understand the paper, they become another confusing figure to decode.
This guide shows how to make a graphical abstract for a research paper, from the core message and layout to journal-ready export and AI-assisted drafting.
We will also show where a tool like FigCanvas can speed up the first draft, and where human scientific judgment still matters.
What Is a Graphical Abstract?
A graphical abstract is a single visual summary of a research paper's main message. It usually shows the study context, method, key result, and conclusion in one compact visual.
A good graphical abstract does not try to replace the full paper. It helps readers quickly understand the story of the paper before they decide whether to read more.
A graphical abstract is different from a regular figure. A regular scientific figure often presents detailed data, statistical comparisons, or experimental results. A graphical abstract is more like a visual entry point. It explains the overall logic of the study.
It is also different from a general infographic. An infographic can explain a broad topic, but a graphical abstract is usually tied to one specific research paper.
Some researchers also search for "graphic abstract," but most journals and publishers use the term "graphical abstract." In this article, we will use the standard term.
Graphical Abstract vs Visual Abstract vs TOC Graphic
Researchers often use these terms interchangeably, but journals do not always mean the same thing.
| Format | Typical use | What it usually emphasizes |
|---|---|---|
| Graphical abstract | Submitted with the paper | Study logic, method, and main finding in one visual |
| Visual abstract | Social media, conference sharing, some clinical journals | A faster, more promotional summary of the takeaway |
| TOC graphic | Table of contents or article landing page | A compact thumbnail tied to one concept or result |
Always follow the terminology used by your target journal. A journal may ask for a TOC graphic when you were planning a full graphical abstract, or allow a visual abstract for promotion but not for manuscript submission. That small terminology check can save a redesign late in the process.
Why Graphical Abstracts Matter
A clear graphical abstract can help your paper stand out in journal tables of contents, search results, social media posts, conference slides, lab websites, and grant presentations.
For researchers, the value is not only aesthetic. A strong graphical abstract helps communicate your study to people outside your immediate field. This is especially important for interdisciplinary work, where readers may not be familiar with every method, pathway, dataset, or experimental model.
A useful graphical abstract should help a reader answer three questions quickly:
- What is the study about?
- What did the researchers do?
- What is the main finding or takeaway?
If your graphical abstract answers those questions clearly, it is already doing its job.

Graphical Abstract Examples by Field
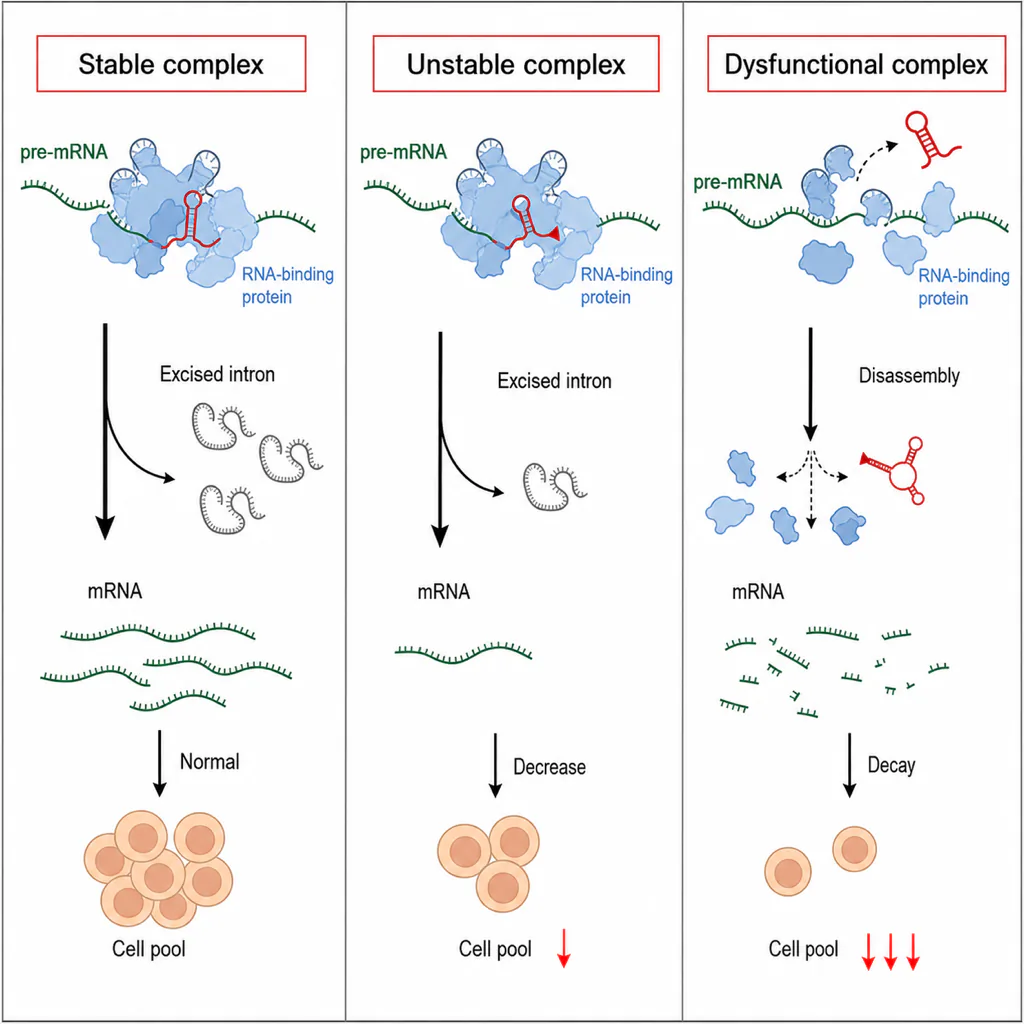
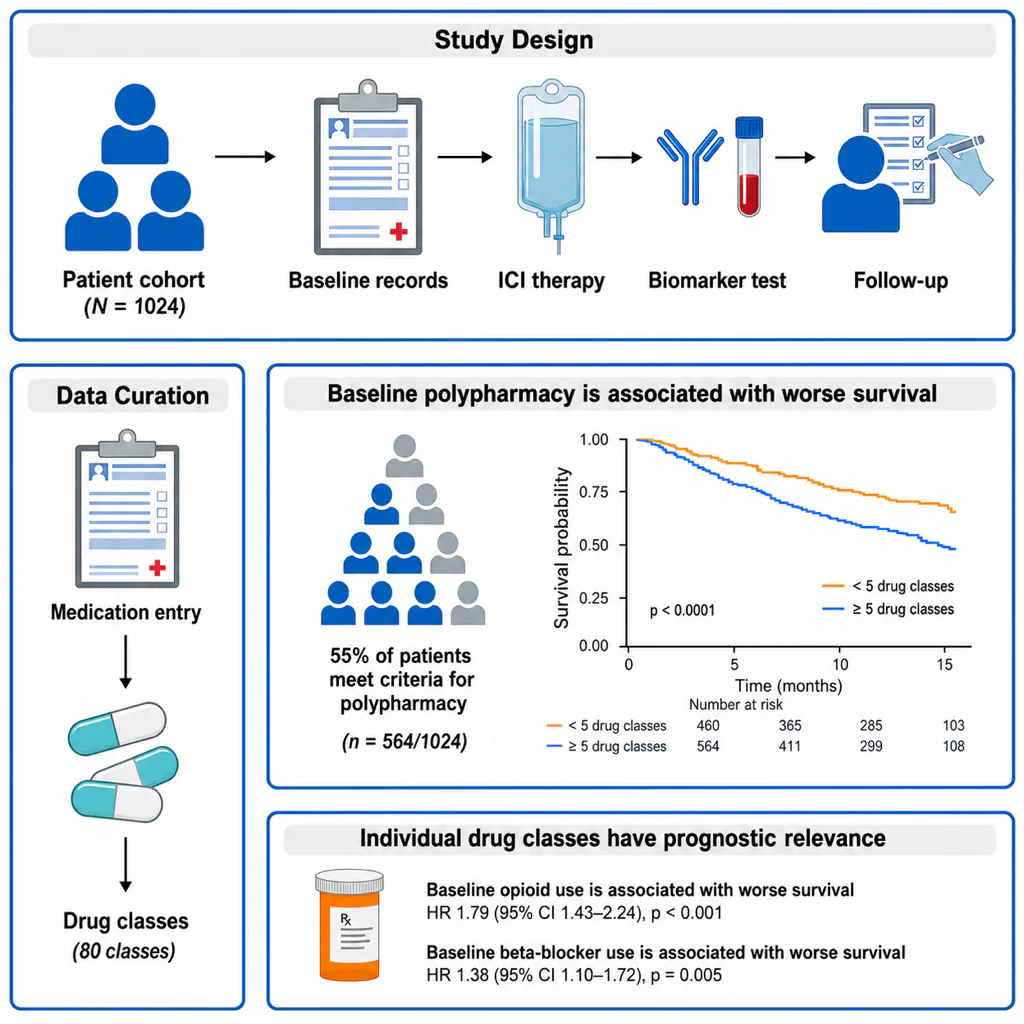
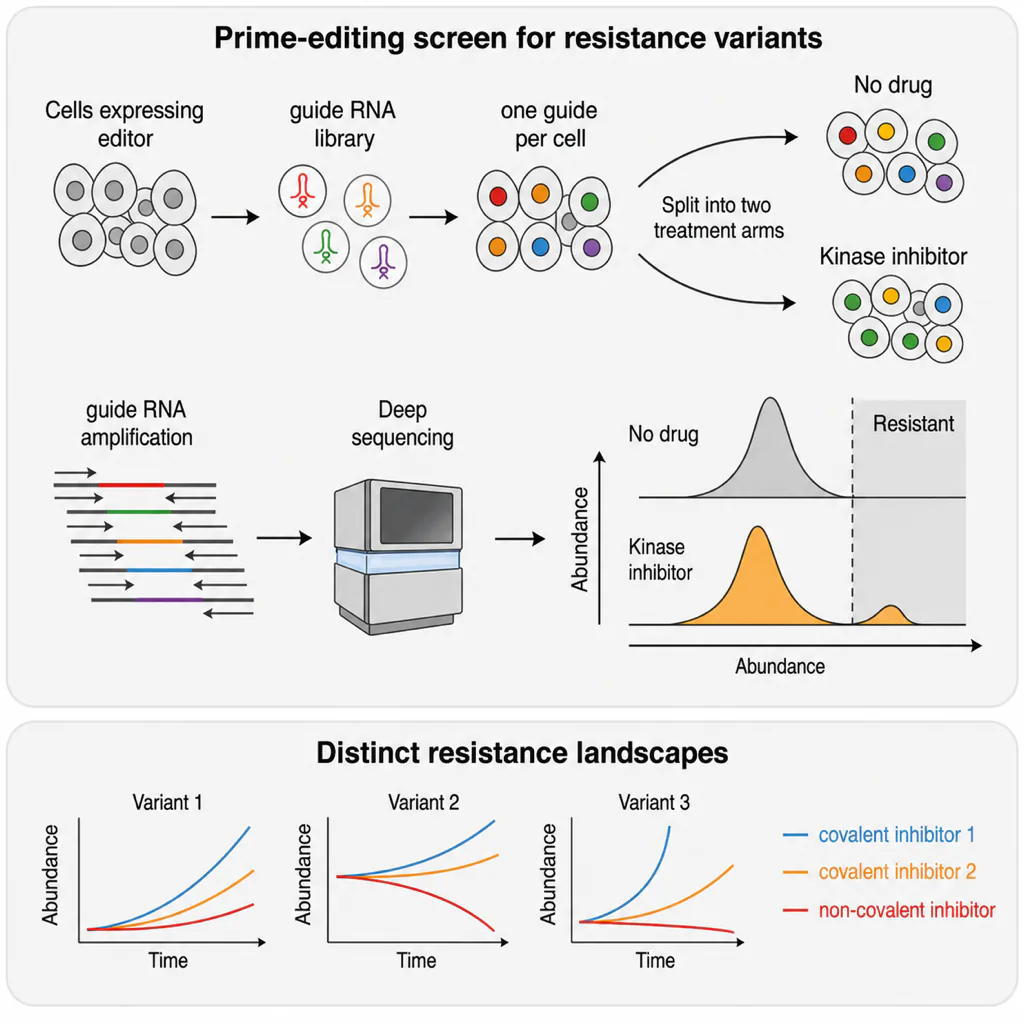
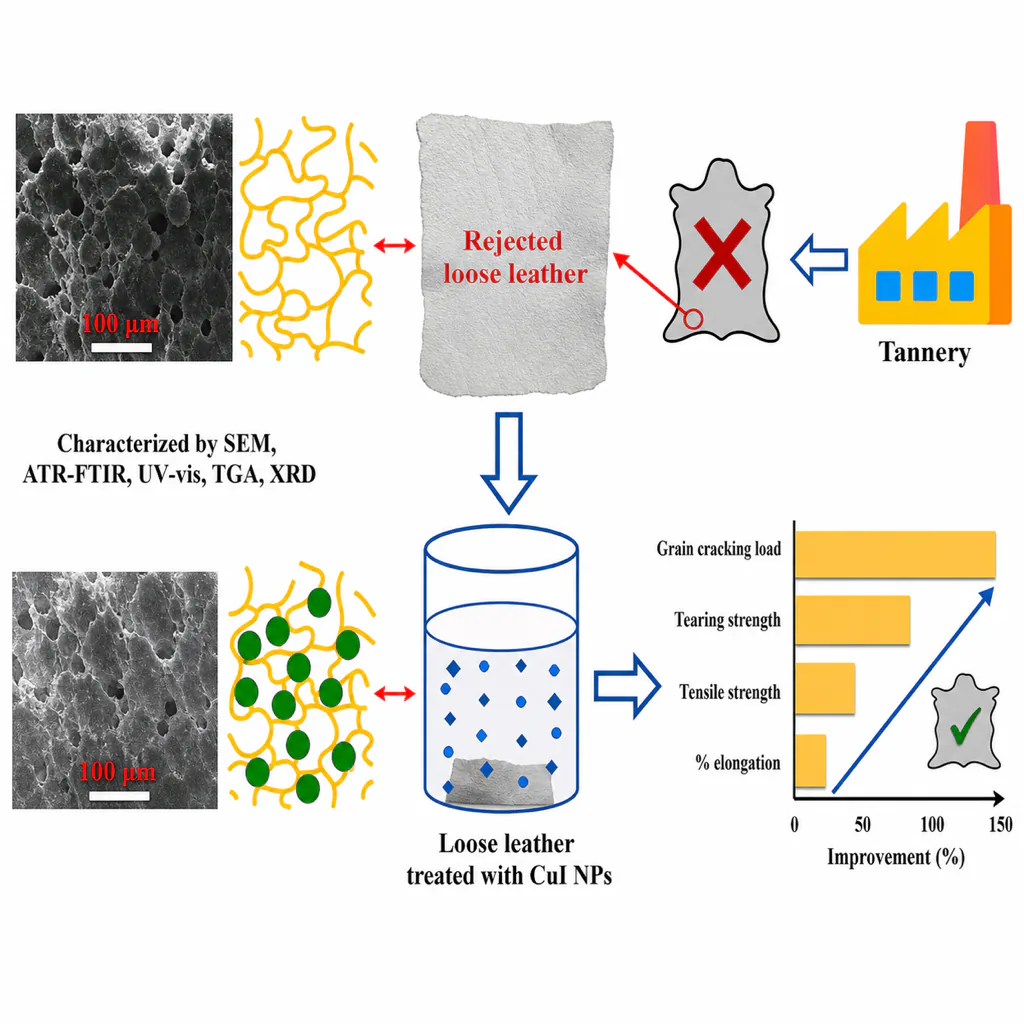
The examples below were drafted in FigCanvas and show the layouts that work most often. Each one tells a single story from left to right or top to bottom, uses short labels, and keeps one accent color. Use them to pick a structure before you start drawing; the graphical abstract maker page has the prompt behind each example.
Molecular Mechanism Example
A cell biology mechanism in three stages: ligand binding at the membrane, a signaling cascade in the cytoplasm, and a transcriptional response in the nucleus. One arrow between each stage keeps the order obvious.
Clinical Study Example
A cohort study told as cohort, intervention timeline, and primary outcome. The outcome panel uses a simple curve comparing the two groups instead of a full results table.
Functional Genomics Example
An input-process-output workflow: sequencing, a screening step, hit selection with a small heatmap, and a validated phenotype.
Materials Science Example
Structure, property, application: the synthesized material on the left, the key mechanism in the center, and the device or use case on the right.
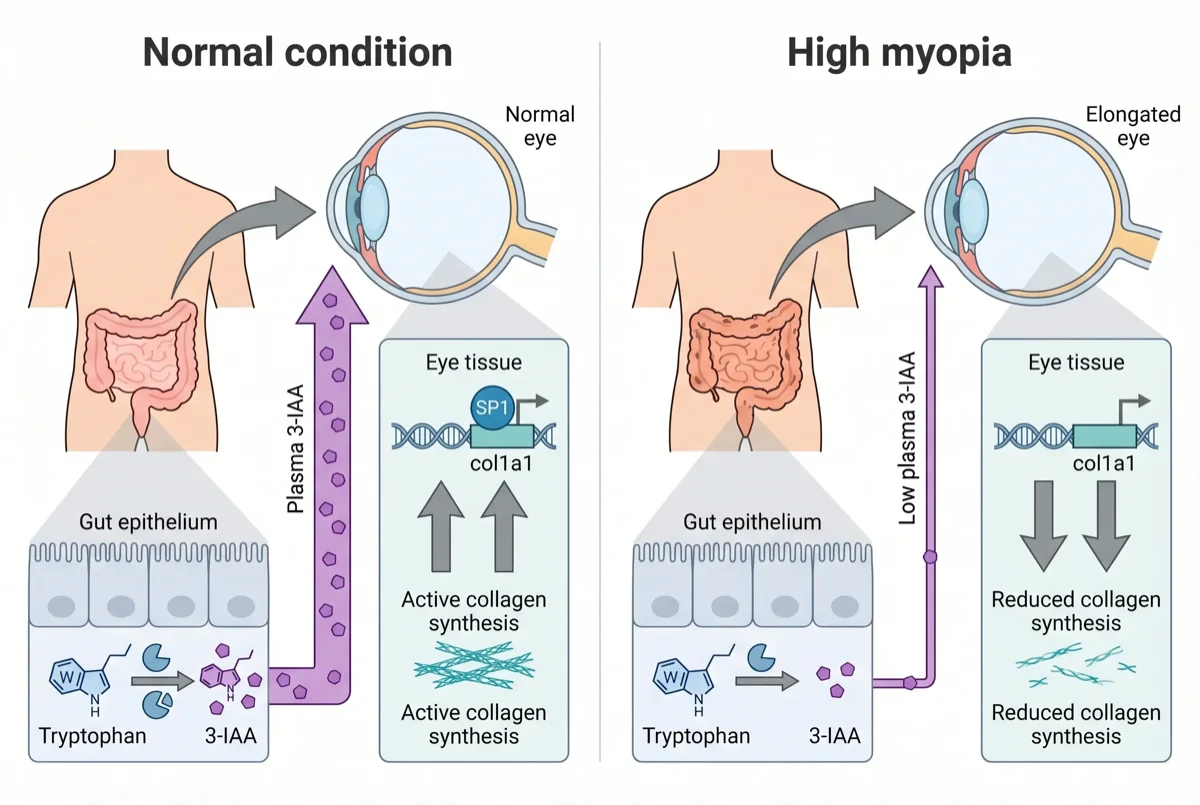
Biological Pathway Example
A body-axis pathway in two connected panels, with a normal state and an altered state side by side so the change is the first thing a reader sees.
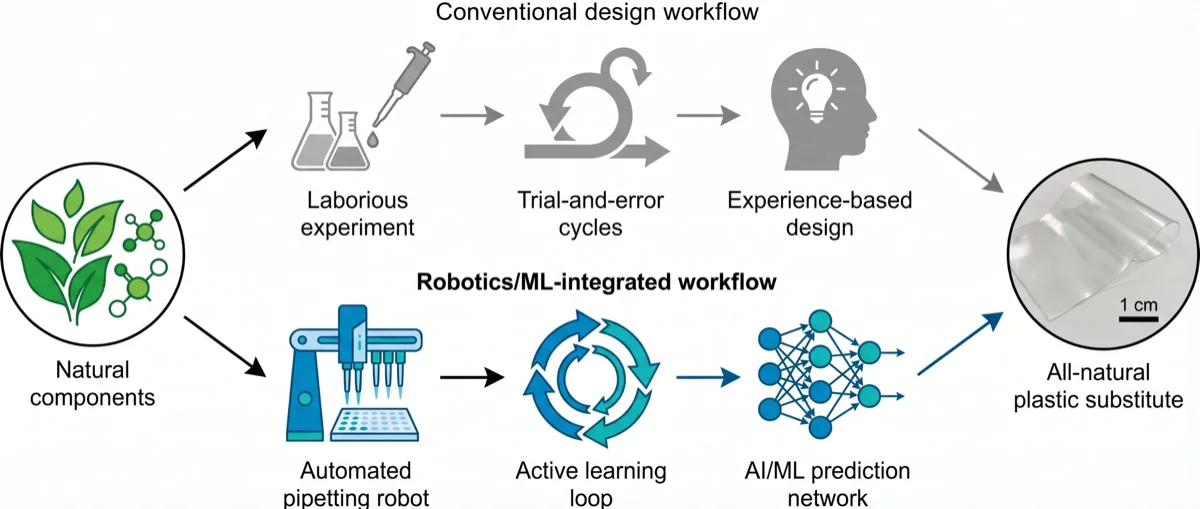
Study Workflow Comparison Example
A before-vs-after layout: a conventional manual workflow in grey above an automated AI and robotics pipeline in the accent color, both ending at the same product.
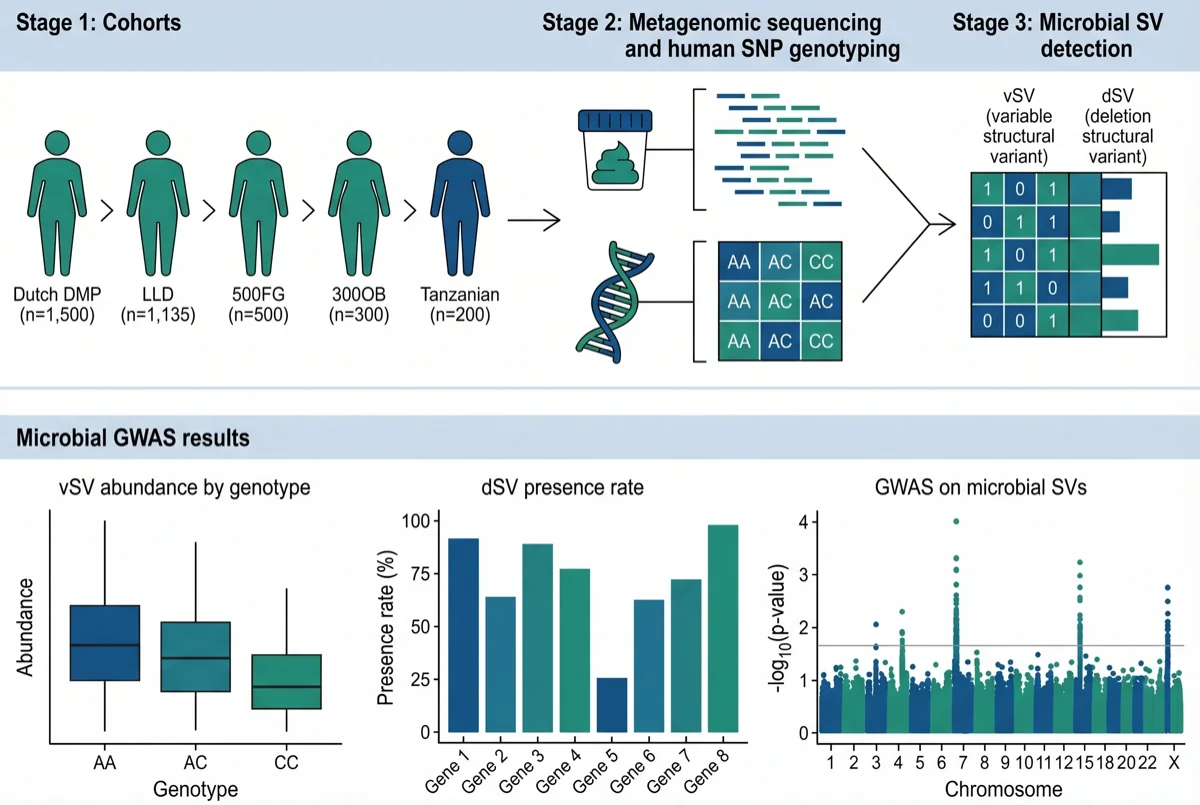
Population Study Design Example
A workflow-plus-key-finding layout: the study pipeline across the top row and two or three result panels underneath.
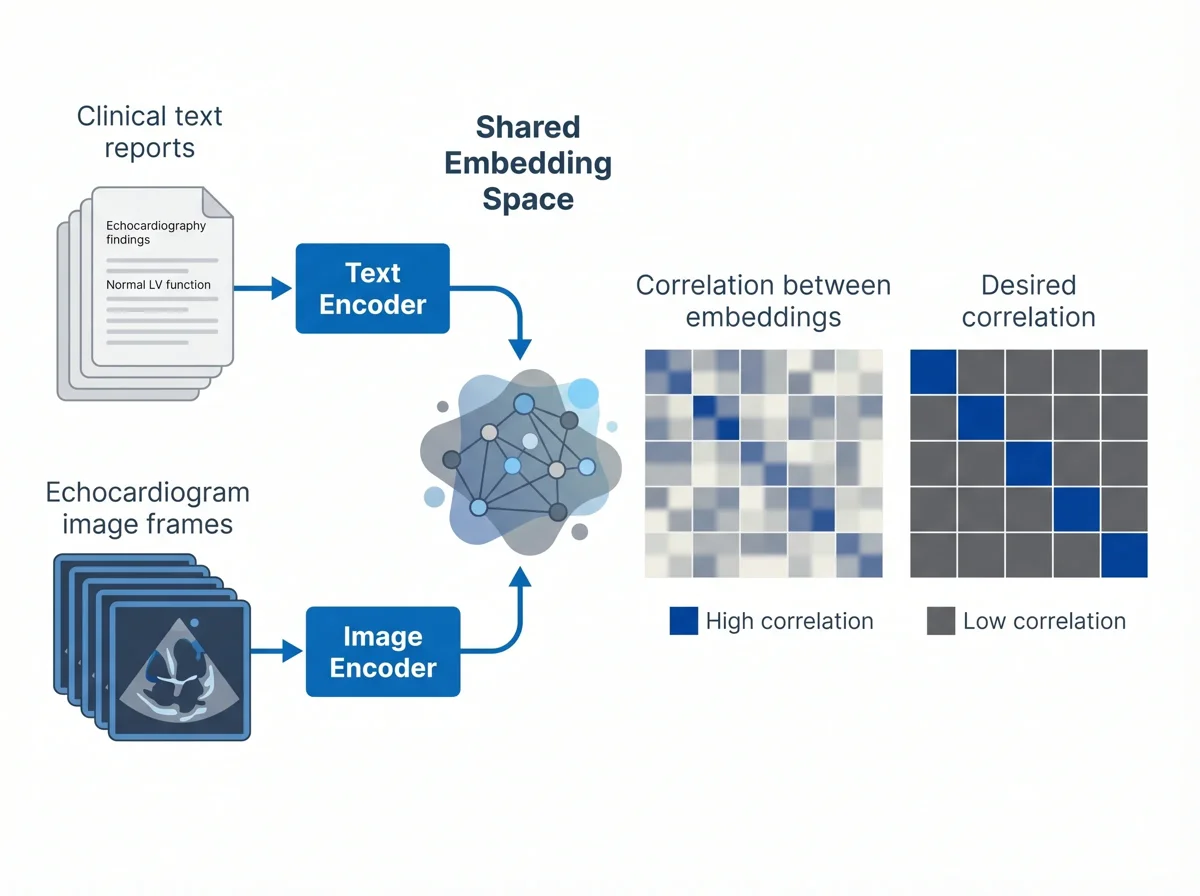
Machine Learning Method Example
Two input modalities entering their encoders, a shared embedding space in the center, and small similarity matrices showing the result.
Step 1: Identify the One Message Your Graphical Abstract Must Communicate
The most common mistake is trying to include everything.
Your paper may have multiple experiments, supplementary analyses, validation cohorts, and technical details. Your graphical abstract should not show all of them. It should communicate the one message readers should remember after seeing the image.
Before you design anything, write one sentence that summarizes the central finding of your paper.
For example:
- Treatment A reduces inflammation through pathway B.
- A new AI model converts microscopy images into quantified cell phenotypes.
- A multi-omics workflow identifies disease-associated cell states.
- A biomaterial scaffold improves tissue repair by changing immune cell behavior.
- A computational pipeline discovers candidate drug targets from single-cell data.
This sentence becomes the foundation of your graphical abstract.
If you cannot summarize the paper in one sentence, the visual will probably become confusing. Spend time clarifying the message before choosing icons, colors, or layout.
If you plan to use FigCanvas, this one-sentence takeaway is also a useful starting prompt. You can expand it with the research context, method, key entities, and preferred visual structure.
Step 2: Choose the Right Graphical Abstract Structure
Different studies need different visual structures. A mechanism paper, a clinical study, and a computational methods paper should not all use the same layout.
Below are five common graphical abstract structures that work well for research papers.
Option A: Problem -> Method -> Result
This is one of the most flexible structures. It works well for experimental biology, medicine, chemistry, materials science, and environmental science.
Use this structure when your paper has a clear research problem, an experimental or analytical approach, and a main result.
Example flow:
Disease model -> Treatment or experiment -> Improved outcome
This layout is easy for readers to follow because it mirrors the basic logic of a research paper.

Option B: Input -> Process -> Output
This structure is especially useful for computational biology, bioinformatics, AI, data science, and software papers.
Use this when your research involves data transformation, algorithmic processing, or a pipeline.
Example flow:
Raw data -> AI model or analysis workflow -> Prediction, visualization, or biological insight
This layout helps readers understand what goes into your method and what comes out of it.
Option C: Mechanism Diagram
A mechanism diagram is useful when you need to show how something works.
This structure is common in molecular biology, cell biology, immunology, neuroscience, pharmacology, and disease mechanism research.
Example flow:
Stimulus -> Receptor activation -> Signaling pathway -> Cellular response
The key is to avoid showing every molecule in the pathway. Focus only on the entities required to understand the paper's main claim.
See the molecular mechanism example above for this layout in a finished graphical abstract.
Option D: Before vs After
This structure works well for treatment, intervention, engineering, and comparison studies.
Example flow:
Before treatment: disease state -> After treatment: improved state
A before-vs-after layout is easy to understand and visually powerful. It can work well when the central result is a clear improvement, reduction, rescue, or transformation.
Option E: Workflow + Key Finding
This structure is useful for methods papers, technology papers, and multi-step experimental designs.
Example flow:
Sample collection -> Sequencing or imaging -> Analysis -> Key discovery
The important part is to end with a clear finding. A workflow alone can feel like a protocol diagram. A graphical abstract should connect the workflow to a scientific takeaway.
Match the Structure to Your Study Type
| Study type | Usually works best | What to emphasize | What to leave out |
|---|---|---|---|
| Mechanistic wet-lab paper | Mechanism diagram or problem -> method -> result | Intervention, pathway logic, phenotype change | Every intermediate molecule |
| Clinical cohort or biomarker study | Workflow + key finding or before vs after | Cohort, sampling, stratification, clinical outcome | Full enrollment-flow detail or all covariates |
| Bioinformatics or AI method paper | Input -> process -> output | Data source, analysis block, final biological or practical output | Every preprocessing step |
| Multi-omics discovery paper | Workflow + key finding | Data types, integration step, main discovery | All QC plots and side analyses |
| Materials or chemistry paper | Problem -> method -> result | Synthesis, mechanism, performance readout | Every characterization panel |
If you cannot say what one visual block should do in each column of that table, the layout is still too broad.
For a clinical cohort or systematic review, the full enrollment or screening flow belongs in a separate figure, not the graphical abstract — build that with the PRISMA flow diagram generator and keep the abstract focused on the single take-home finding.
Step 3: Sketch the Story Before Designing
Do not start with colors, icons, or visual effects.
Start with a rough sketch. You can use paper, a whiteboard, a slide, or a simple drawing tool. At this stage, the goal is not to make the graphical abstract beautiful. The goal is to decide what goes where.
Ask yourself:
- Should the story move left to right or top to bottom?
- What are the three to five main visual blocks?
- Where should the key result appear?
- Which parts need labels?
- Where do arrows guide the reader?
- Which details can be removed?
A good graphical abstract usually has a visible flow. The reader should not need to guess where to look first.
For most research papers, left-to-right flow works well:
Context -> Method -> Result -> Conclusion
Top-to-bottom flow can also work when the study has layers, hierarchy, or a pipeline.
Input
|
Analysis
|
Output
|
Biological insight
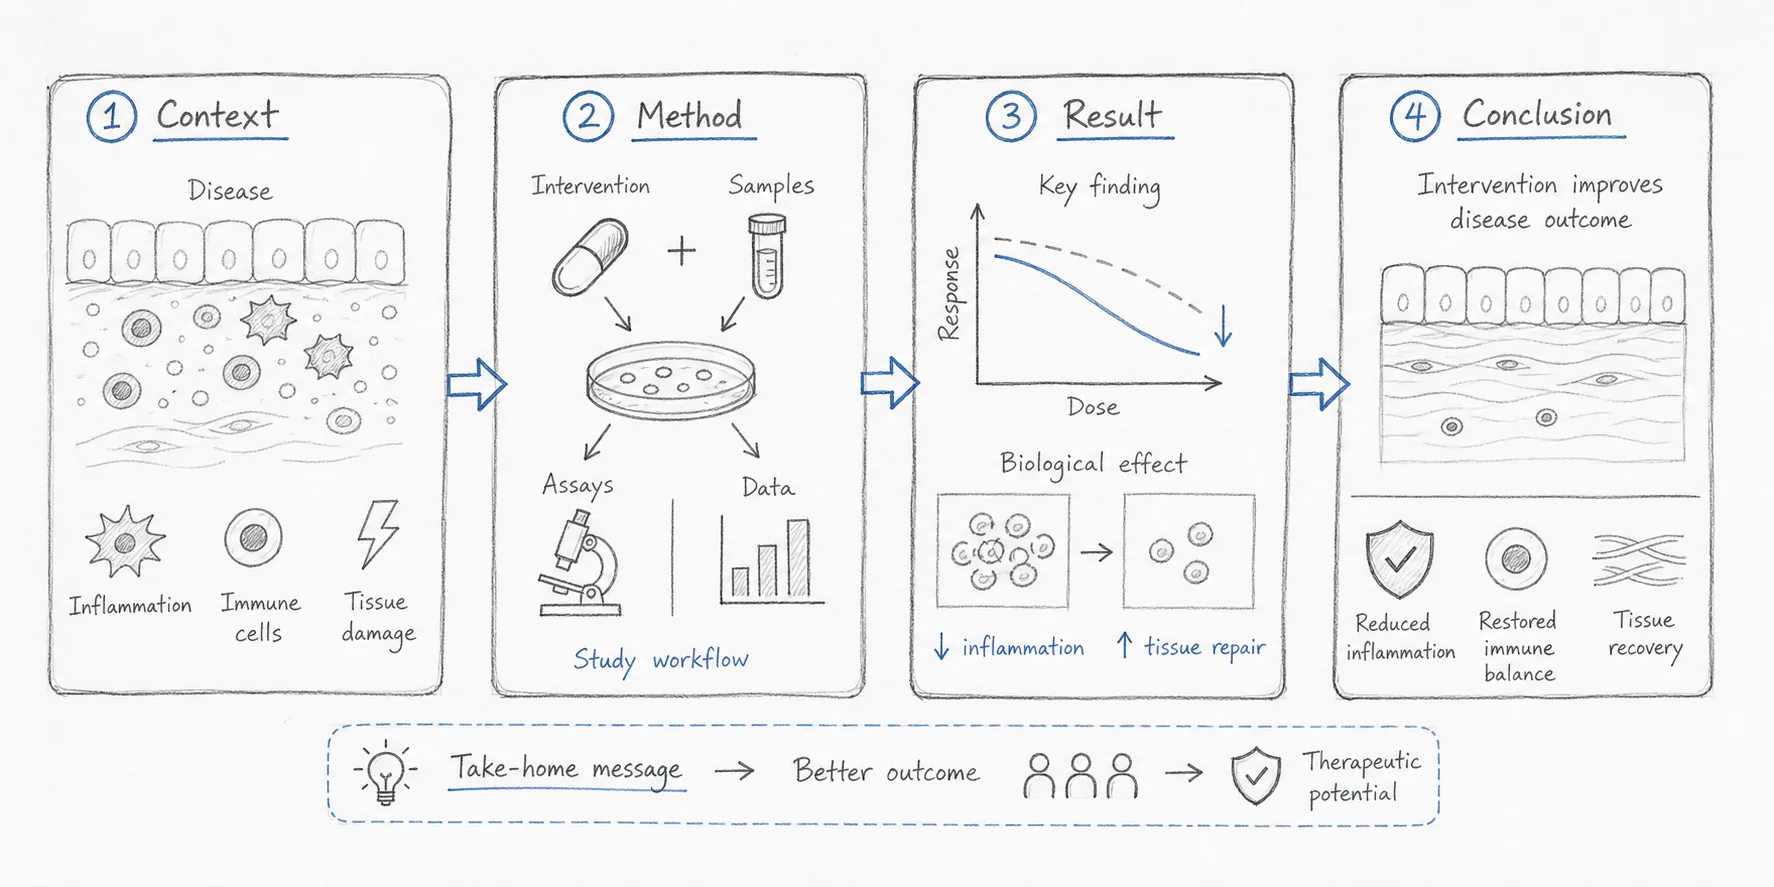
If you already have a rough structure, you can also use it as a prompt in FigCanvas. Describe the flow, the main entities, and the final takeaway, then use the generated draft as a starting point for refinement.
Step 4: Keep Text Short and Visual Hierarchy Clear
A graphical abstract should not be a paragraph with icons around it.
If you copy sentences from the written abstract into the figure, the visual will quickly become crowded. Use short labels instead.
Good labels are usually two to five words:
- Tumor microenvironment
- Single-cell RNA-seq
- Immune activation
- Reduced inflammation
- Improved survival
- Candidate drug targets
- Automated figure generation
Avoid long labels such as:
The treatment significantly reduced inflammatory cytokine expression in the experimental disease model
That level of detail belongs in the paper, not the graphical abstract.
Visual hierarchy also matters. The most important result should be the easiest thing to notice. You can create hierarchy through size, placement, contrast, and spacing.
A simple rule: if everything is emphasized, nothing is emphasized.
Step 5: Use a Consistent Scientific Visual Style
A graphical abstract does not need to look flashy. It needs to look clear, credible, and publication-ready.
Consistency is more important than decoration.
Use a limited color palette. Two or three main colors are usually enough. If you need more colors, assign them meaningful roles, such as different cell types, treatment groups, molecular states, or analysis steps.
Keep icon style consistent. Avoid mixing realistic 3D renderings, flat icons, hand-drawn illustrations, and stock images in the same figure unless there is a clear design reason.
Keep line weights consistent. Arrows, outlines, boxes, and connectors should feel like they belong to the same visual system.
Also make sure your figure still works when it is small. Many readers will first see your graphical abstract as a thumbnail.
A useful test is to zoom out. If the visual flow disappears or the text becomes unreadable, the design is probably too complex.
If you are still deciding between AI-native tools, icon libraries, and vector editors, our guide to scientific illustration software covers the tradeoffs. The tool choice matters less than the story structure, but it does affect how quickly you can iterate.
Step 6: Check Journal Guidelines Before Exporting
Before finalizing your graphical abstract, check the author instructions for your target journal.
Different journals may have different requirements for size, resolution, file type, font readability, and whether text is allowed inside the graphical abstract. Some journals also provide specific templates or examples.
For reference, Elsevier's graphical abstract guidance describes graphical abstracts as concise visual summaries for helping readers understand the main message quickly, while the Cell Press graphical abstract guidelines specify a single-panel square image and simple labels. Chemistry journals may use different terminology, so also check ACS guidance for table of contents and abstract graphics when preparing TOC-style figures.
Common requirements may include:
- High-resolution image export
- Readable text at small size
- A specific aspect ratio or canvas size
- Accepted file formats such as TIFF, JPEG, PNG, PDF, EPS, or SVG
- No unnecessary decorative elements
- No excessive text
- No duplicated information from the title or abstract
A Practical Pre-Submission Check
| Item | What to verify | Why it matters |
|---|---|---|
| Canvas ratio | Match the journal's shape before final polishing | Avoid rebuilding the full layout at the end |
| Text size | Still readable when the figure is reduced on screen | Many readers first see it as a small thumbnail |
| File type | Use vector output when allowed, raster output when required | Sharp arrows and labels survive export better |
| Resolution | Export at the requested DPI; 300 DPI is a common minimum for color figures | Low-resolution text looks unprofessional fast |
| Color palette | Distinguishable without relying only on red vs green | Better accessibility and better reviewer readability |
| Terminology | Abbreviations, labels, and claims match the manuscript exactly | Inconsistency makes the figure feel unreliable |
Do not wait until the end to check these requirements. If you design the figure in the wrong aspect ratio, you may need to rebuild the layout.
If your graphical abstract includes a simplified data panel such as a volcano plot, run the same small-size test on that panel too. Labels that look fine at full screen often disappear at journal column width.
Step 7: Make a First Draft with AI, Then Refine It in FigCanvas
Many researchers do not struggle because they lack design taste. They struggle because they do not know how to translate a dense methods section into a visual story.
This is where AI can help.
An AI graphical abstract workflow can help you move from a blank canvas to a structured first draft. You can start with a paper summary, method description, main finding, or rough visual idea. Then you can refine the layout, labels, colors, and scientific details.
AI is especially useful for:
- Generating layout ideas
- Turning a methods section into a workflow diagram
- Creating a first draft of a mechanism illustration
- Exploring different visual directions
- Converting a rough prompt into a structured scientific visual
- Creating variations for different audiences
However, AI should not be treated as the final scientific reviewer. The researcher still needs to check accuracy, labels, biological relationships, data interpretation, and journal requirements.
Think of AI as a drafting partner, not a replacement for scientific judgment.
Use AI Without Introducing Scientific Errors
AI speeds up drafting, but it also creates failure modes that do not appear in manual drawing.
- Do not let the model invent molecules, cohorts, organs, or workflow steps that are not in the paper.
- Check that every arrow means the right thing: association, inhibition, activation, transport, or sequence.
- Verify species, tissue, cell type, experimental model, and timepoint.
- Remove quantitative claims unless the manuscript explicitly supports them.
- If your journal or institution requires disclosure, note the AI tool used and the human review or editing step.
A useful rule is that every label, arrow, icon, and outcome in the graphical abstract should be traceable to a sentence, figure, or table in the manuscript. If you cannot point to the source, revise it or remove it.
Want to skip the blank canvas? Try FigCanvas to generate a first graphical abstract draft from your research summary, method description, or figure prompt.

Graphical Abstract Prompt Examples
If you use FigCanvas or another AI-assisted design workflow, the prompt matters. A good prompt should include the research topic, main entities, visual structure, key finding, and preferred style.
The examples below are written in a format that works well for FigCanvas: research context first, visual structure second, and style direction last.
Below are example prompts you can adapt.
Biomedical Mechanism Prompt
Create a clean graphical abstract for a biomedical research paper. Show how Treatment A reduces inflammation in a mouse disease model by inhibiting Pathway B in macrophages. Use a left-to-right structure: disease state, treatment intervention, pathway inhibition, reduced inflammatory cytokines, and improved tissue recovery. Use a modern scientific illustration style with clear labels, arrows, and a limited blue-green color palette.
Bioinformatics Workflow Prompt
Create a graphical abstract for a bioinformatics paper. Show an input-process-output workflow where single-cell RNA-seq data and spatial transcriptomics data are integrated by an AI model to identify disease-associated cell states. Use a clean research workflow diagram style with data matrices, tissue sections, model architecture, and final biological insight. Keep labels short and readable.
Clinical Study Prompt
Create a graphical abstract for a clinical research paper. Show a patient cohort, sample collection, biomarker measurement, risk stratification, and improved treatment decision-making. Use a professional medical research visual style with simple icons, clear arrows, and a concise final takeaway.
Materials Science Prompt
Create a graphical abstract for a materials science paper. Show the synthesis of a nanostructured material, its surface modification, interaction with target molecules, and improved performance in sensing. Use a clean left-to-right layout with molecular-level illustrations, arrows, and a final performance readout.
AI Method Paper Prompt
Create a graphical abstract for an AI scientific method paper. Show raw experimental images entering a deep learning model, automated feature extraction, quality-controlled outputs, and publication-ready scientific figures. Use a clean computational workflow style with data panels, model blocks, and final visual outputs.
Copy one of these prompts into FigCanvas and adapt it to your study.
What Reviewers and Editors Notice First
A graphical abstract rarely gets line-by-line reviewer comments, but it does shape the first impression of the paper. In practice, editors and reviewers tend to notice:
- Whether the main claim is obvious without reading the full abstract
- Whether the visual tells the same story as the results section
- Whether arrows, labels, and color coding have clear meaning
- Whether the key result is prominent rather than buried in method detail
- Whether the figure stays legible when embedded in a PDF or shown as a thumbnail
If the answer to one of these is no, the figure may still be attractive, but it is not yet doing its scientific job.
Common Graphical Abstract Mistakes to Avoid
Even a scientifically strong paper can have a weak graphical abstract. Here are common mistakes to watch for.
Mistake 1: Too Much Text
If the figure looks like a paragraph, it is no longer functioning as a visual summary.
Use labels, not sentences. Move detailed explanations into the figure caption or main text.
Mistake 2: Too Many Panels
A graphical abstract is not a multi-panel results figure. If you include every experiment, the reader will not know what matters most.
Aim for a simple story with a few visual blocks.
Mistake 3: No Clear Take-Home Message
A beautiful figure can still fail if the conclusion is unclear.
The reader should understand the main finding without needing to read the full abstract first.
Mistake 4: Inconsistent Icons or Visual Styles
Mixing random icons, stock illustrations, screenshots, and data plots can make the figure feel unprofessional.
Use a consistent style across all visual elements.
Mistake 5: Weak Visual Flow
If arrows point in multiple directions or the layout has no reading order, the viewer will feel lost.
Guide the eye with clear structure.
Mistake 6: Using a Regular Data Figure as the Graphical Abstract
A volcano plot, heatmap, microscopy image, or survival curve may be important, but it usually cannot explain the whole paper by itself.
You can include a simplified data element, but the graphical abstract should still tell the broader research story.
Mistake 7: Ignoring Journal Format Requirements
A graphical abstract that looks good on your screen may not meet journal submission requirements.
Check the required size, resolution, and file type before export.
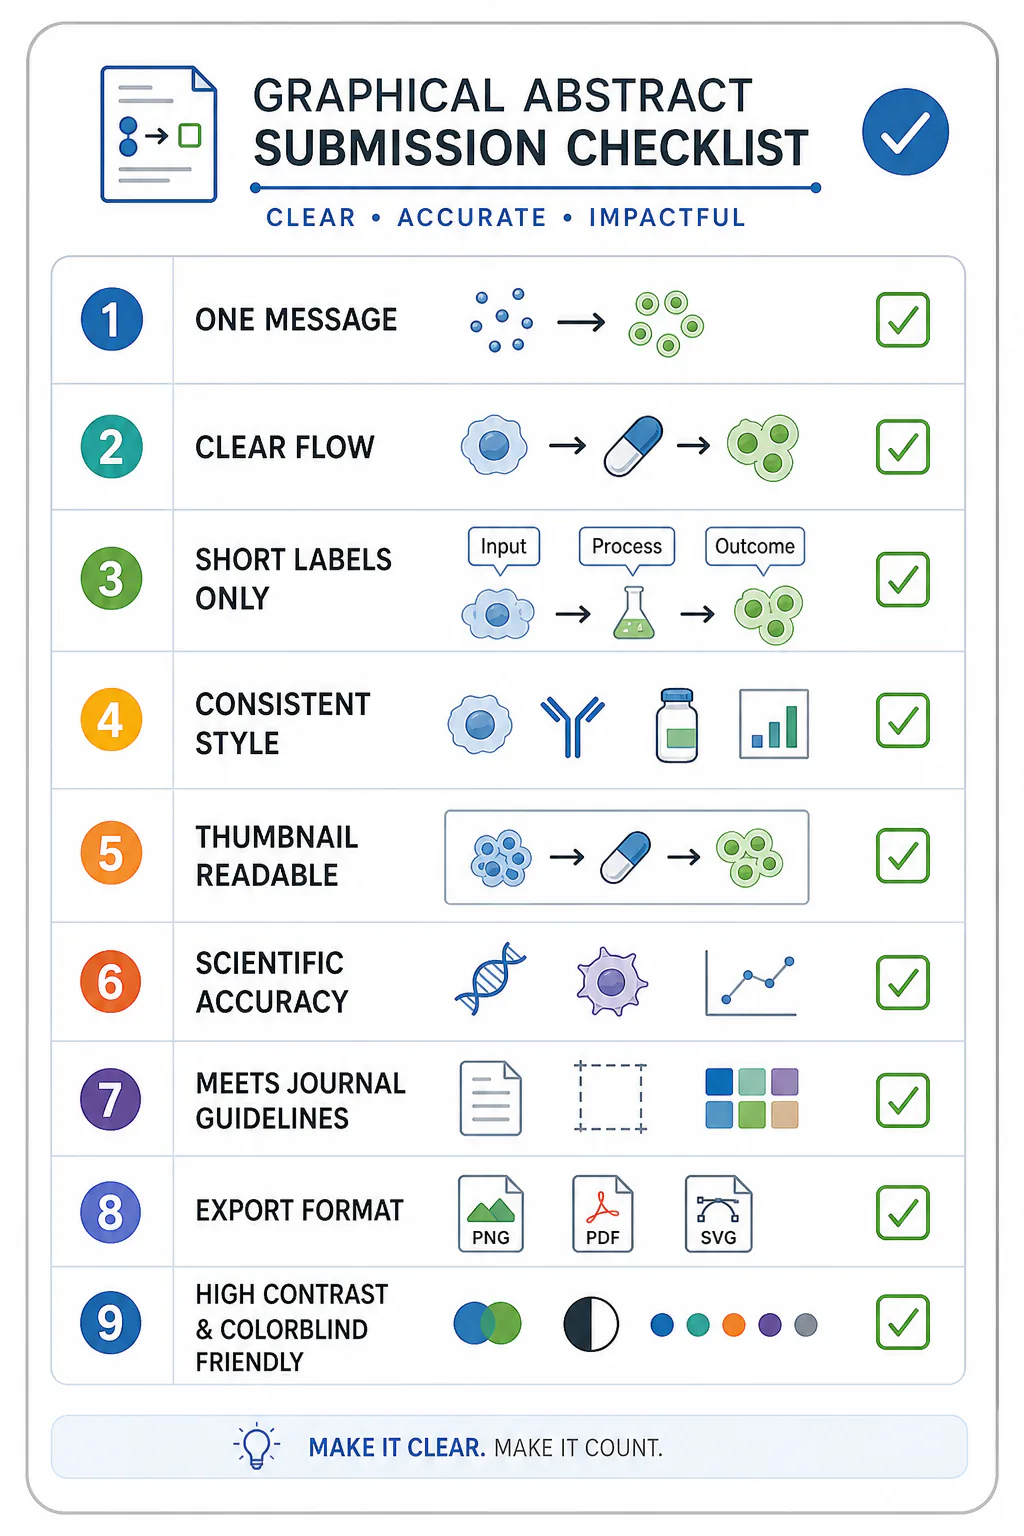
Graphical Abstract Checklist
Before you submit or publish your graphical abstract, use this checklist.
- Does it communicate one main message?
- Can a reader understand the visual flow in a few seconds?
- Is the text short and readable?
- Are the most important elements visually emphasized?
- Are icons, colors, arrows, and labels consistent?
- Does the figure still work as a small thumbnail?
- Are unnecessary details removed?
- Does the final visual match the paper's scientific claim?
- Have you checked the target journal's guidelines?
- Do you have the correct export format and resolution?
Create a Graphical Abstract Faster with FigCanvas
Creating a graphical abstract from scratch can be slow, especially when you are trying to turn a complex research story into a clear visual layout.
FigCanvas helps researchers create scientific visuals from prompts, paper summaries, methods descriptions, and rough ideas. Instead of starting from a blank canvas, you can generate a first draft and refine it into a more polished research figure.
You can use FigCanvas as a graphical abstract maker for:
- Graphical abstracts
- Scientific illustrations
- Research workflow diagrams
- Bioinformatics pipelines
- AI method diagrams
- Data visualization concepts
- Multi-panel scientific figure planning
The goal is not to replace your scientific judgment. The goal is to help you move faster from idea to visual draft.
Create your first graphical abstract with FigCanvas. Free to start, no credit card required.
Graphical Abstract Maker, Generator, or AI Tool: Which Term Fits
Searchers look for a "maker," a "generator," and an "AI tool" almost interchangeably, but the words map to slightly different expectations:
- A maker implies you stay in control and assemble the layout yourself. FigCanvas works this way — every element on the canvas stays editable.
- A generator implies the first draft is produced for you from a prompt or paper summary. FigCanvas does that too, then hands you an editable figure rather than a locked image.
- An AI tool implies text-to-figure with iterative refinement. That is the core loop here: describe the study, generate a draft, refine it in plain language.
In practice the tool is all three at once — an AI-assisted maker that generates a first draft online and keeps it fully editable, so you are never stuck with an export you cannot change.
FAQ
What is a graphical abstract?
A graphical abstract is a single visual summary of a research paper's main message. It usually shows the study context, method, key result, and conclusion in a compact visual format.
What is the difference between a graphical abstract and a visual abstract?
The terms are often used similarly, although "graphical abstract" is more common in journal publishing. A visual abstract can sometimes refer to a broader visual summary used for social media, presentations, or medical communication.
What is the difference between a graphical abstract and a TOC graphic?
A graphical abstract usually summarizes the logic and finding of the full paper. A TOC graphic is often smaller and more compact, designed to catch attention in a journal table of contents or article listing. Some journals ask for one, the other, or both.
What should a graphical abstract include?
A graphical abstract should include the core research question, the main method or workflow, the key finding, and a clear visual conclusion. It should not include every experiment or all supporting data.
How do I make a graphical abstract for a research paper?
Start with one take-home message, choose a simple layout, sketch the visual flow, add only essential labels, use a consistent visual style, and check your target journal's formatting requirements before export.
Can I use AI to make a graphical abstract?
Yes. AI can help generate a first draft from your research summary, method description, or figure prompt. You should still review the scientific accuracy, labels, layout, and journal requirements before submission.
Do I need to disclose AI use in a graphical abstract?
Possibly. Policies vary by journal and institution. If AI materially helped generate or edit the figure, check the author instructions and local research integrity guidance. When disclosure is requested, state the tool used and describe the human verification and editing you performed.
What file format should I use for a graphical abstract?
Follow your target journal's instructions. Vector formats can be useful for revision when they are accepted, while high-resolution raster export is often required for submission systems. In practice, the right answer is usually the format the journal asks for, not the format that feels most convenient.
Can FigCanvas help me make a graphical abstract?
Yes. FigCanvas can help generate a first graphical abstract draft from a research summary, methods description, or visual prompt. You can then refine the scientific details, labels, layout, and export format before using it in a paper, presentation, or lab website.
Do all journals require graphical abstracts?
No. Some journals require graphical abstracts, some recommend them, and others treat them as optional. Always check the author instructions for your target journal before creating the final version.
How much text should a graphical abstract have?
Use as little text as possible while keeping the figure understandable. Short labels are usually better than full sentences. If a sentence is required to explain the visual, the layout may need to be simplified.
Can a graphical abstract include data plots?
Yes, but data plots should usually be simplified. A graphical abstract should communicate the research story, not reproduce a full results figure. If you include a chart, make sure it supports the main takeaway.
Is a graphical abstract useful outside journal submission?
Yes. A clear graphical abstract can also be used in presentations, posters, social media posts, lab websites, grant materials, and research summaries.
Is there a free graphical abstract maker or generator online?
Yes. FigCanvas is a free-to-start, online graphical abstract maker — no install and no credit card to begin. You describe your study or paste a summary, it generates an editable first draft in the browser, and you refine the layout before exporting at journal resolution. Paid tiers add higher-quality export and code download.
Is FigCanvas an AI graphical abstract generator?
Yes. It is an AI-assisted generator: give it a prompt, methods description, or paper summary and it produces a first-draft figure you then edit on the canvas. The AI creates the starting layout, and you keep full control over wording, icons, and visual flow so the final figure reflects your science rather than a fixed template.