
The way researchers make figures has fundamentally shifted in the last two years, and most "best scientific illustration software" lists haven't caught up. They're still ranking the same eight icon-library tools that defined the 2018–2023 era — BioRender, Mind the Graph, Illustrator with biology icon packs — as if nothing has changed.
Something has. AI-native scientific illustration software — tools that generate publication-quality figures directly from a prompt, with no icon to drag — now produces results that match the figures in Nature Methods and Cell Reports Methods, in a fraction of the time, across any scientific domain. The four figures above span clinical AI, medical mechanism, nanofabrication, and experimental workflow design — all generated in FigCanvas, no icon library involved. This guide is about which paradigm to use in 2026, not which template library is biggest.
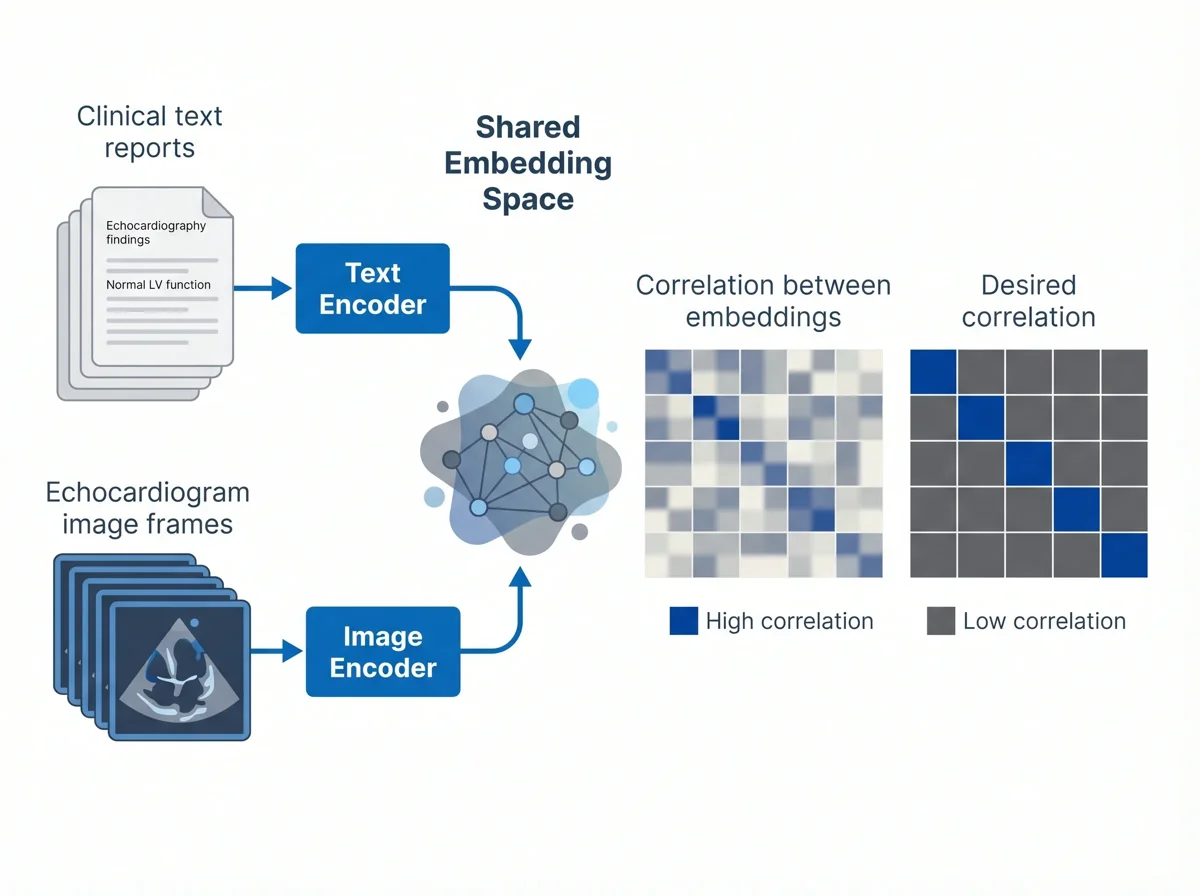
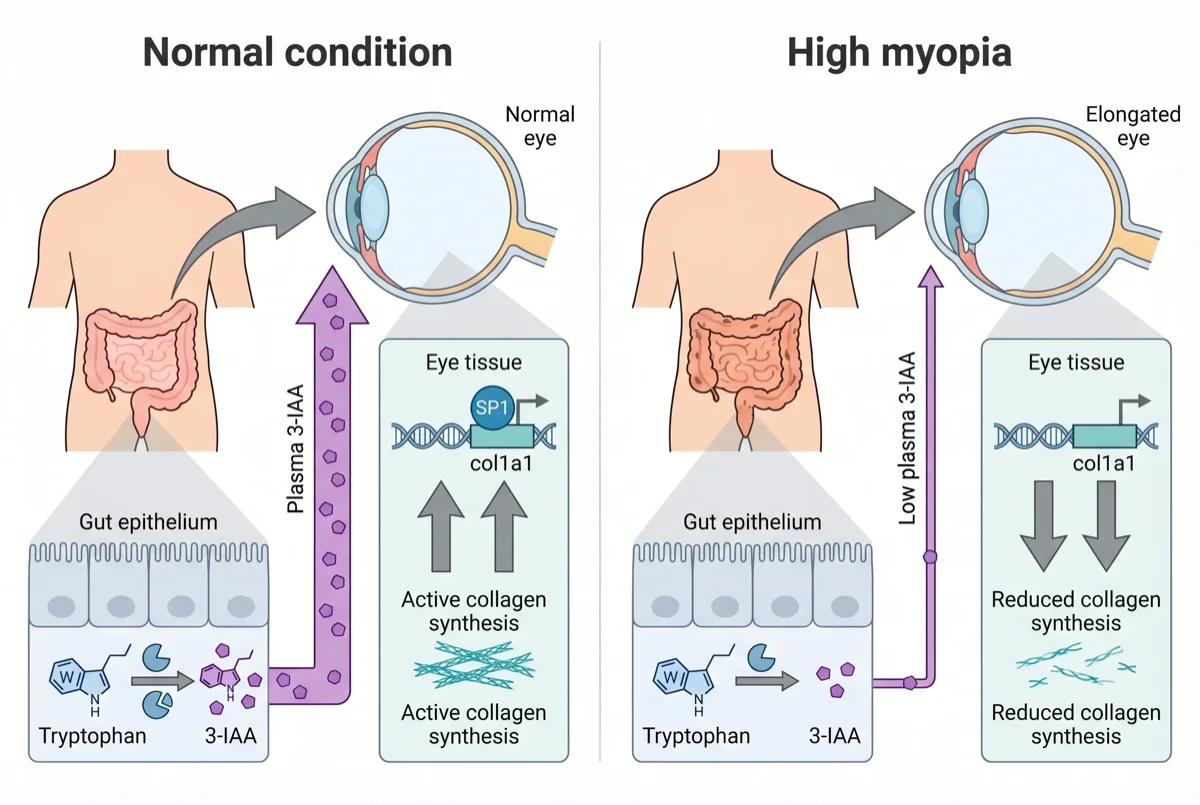
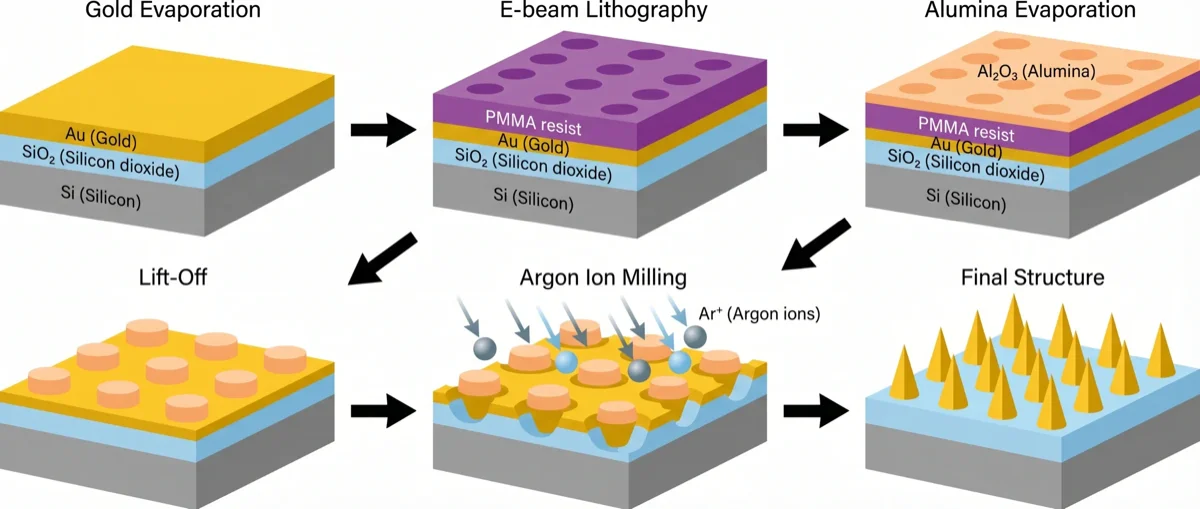
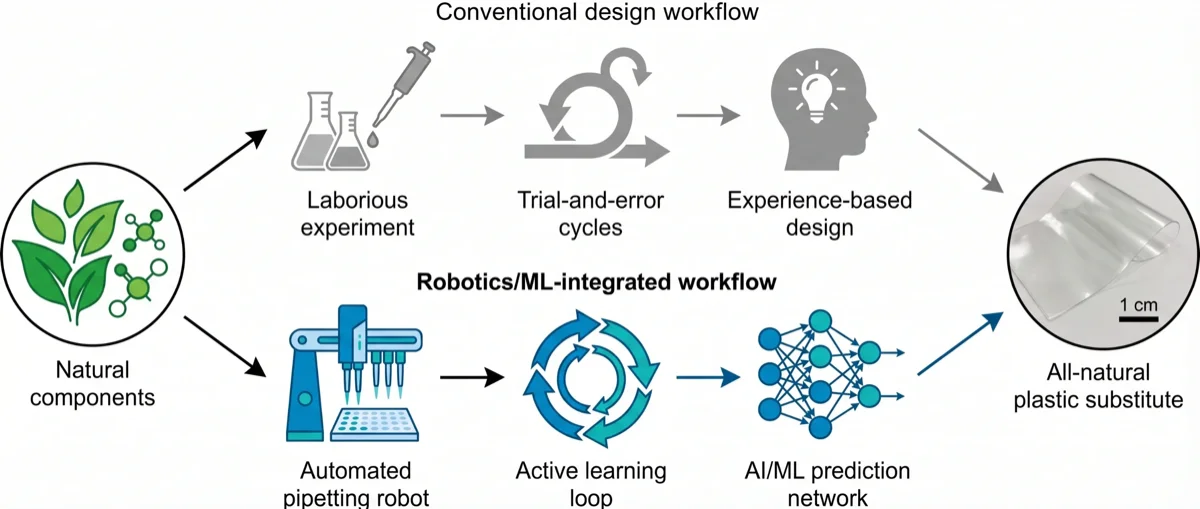
Four figures spanning clinical AI, medical mechanism, nanofabrication, and ML-driven experimental workflows — all generated in FigCanvas, none assembled from icon libraries.
Two paradigms, only one is winning
Every scientific illustration tool today falls into one of two camps:
| Icon library (BioRender, Mind the Graph) | AI-native (FigCanvas) | |
|---|---|---|
| How you make a figure | Browse library, drag 20–40 icons onto canvas, arrange manually | Describe what you want, get a complete figure |
| Time per figure | 30–90 minutes for a moderate pathway | 1–3 minutes |
| Coverage | Limited to what's in the library | Anything you can describe |
| Custom requests | "Not in the library" = build it yourself in Illustrator | Re-prompt until correct |
| Data charts | Not supported (most icon tools do illustration only) | First-class — same canvas as illustrations |
| Cost | $39/month (BioRender) | $19.9/month (FigCanvas) |
The icon-library era made sense when AI couldn't generate accurate biological structures. That assumption no longer holds in 2026. AI generation now handles cellular components, signaling cascades, anatomical cross-sections, ML architecture diagrams, and molecular schematics at journal-methods quality — and crucially, it isn't bounded by what someone already drew and uploaded.
What this looks like in practice
Three jobs that used to take a whole afternoon:
A T-cell exhaustion signaling pathway. Old way: open BioRender, search for "T cell," drag the cell, search for each receptor (TCR, PD-1, CTLA-4, LAG-3), drag, position, draw arrows between them, label each. ~45 minutes if the icons exist; longer if they don't and you fall back to Illustrator. AI-native way: type "T cell exhaustion pathway showing TCR, PD-1, CTLA-4, LAG-3 receptors with downstream inhibitory signaling to NFAT and AP-1." Wait 20 seconds. Iterate twice. Done in three minutes.
A combined data + illustration figure. This is the case BioRender genuinely cannot do — it's an illustration tool only, no charts. With an AI-native canvas, your bar chart of cytokine levels and your schematic of the experimental setup live on the same surface, exported as one figure. No round-tripping through Illustrator to glue them together.
A graphical abstract. Both paradigms can produce one, but the AI-native version skips the "find an icon for everything" step. FigCanvas isn't yet specifically optimized for graphical abstracts (a planned focus area), but it produces serviceable ones today via prompting.
A study flow diagram. Systematic reviews and clinical trials need a PRISMA or CONSORT flow chart — boxes, counts, and exclusion arrows that are tedious to align by hand. The PRISMA flow diagram generator drafts the whole diagram from your screening counts in seconds, then lets you edit every box online.
What still needs the old tools
Two narrow cases where icon libraries or vector editors retain an edge:
- You're already 80% through a BioRender figure — finishing it there is faster than restarting. Don't fight sunk cost on the figure you're submitting tomorrow.
- A reviewer asks for a specific edit you can only do in vector — open the SVG export in Inkscape (free) or Illustrator, make the change, re-export. Both AI-native and icon-library outputs are vectors, so this works either way.
Notice what isn't on this list: "BioRender's icons are higher quality." In 2026, that's no longer true for most use cases. The remaining gap is familiarity — your PI has seen 100 BioRender figures and zero from anywhere else. That's a brand-recognition argument, not a tool-quality argument, and it erodes every quarter.
Free and open-source BioRender alternatives
Two searches show up constantly here: a free BioRender alternative and an open-source one. They are not the same thing, and the distinction matters before you commit a lab to a tool.
- Free (as in no cost to start) — FigCanvas has a free tier with publication rights intact, and Inkscape is fully free forever. Both let you produce a submittable figure without paying, unlike BioRender's free plan, which blocks published use.
- Open source (as in the code is yours to inspect and self-host) — here the honest answer is Inkscape for vector work, or general-purpose libraries like matplotlib and D3 for charts. There is no drop-in, open-source icon-library clone of BioRender that matches its biomedical coverage today.
If your requirement is "stop paying and keep publication rights," a free AI-native tool solves it now; if the requirement is strictly open source, expect to trade convenience for control. For a full feature-by-feature comparison, see the BioRender alternative breakdown.
Why pick FigCanvas specifically
FigCanvas is the AI-native option built for working scientists, not designers:
- Direct prompt-to-figure for pathway diagrams, mechanism schematics, and cell biology illustrations
- Data charts on the same canvas — volcano plots, KM curves, bar charts with error bars, heatmaps, all with journal palettes (Nature, Cell, Science, NEJM, Lancet, PNAS) built in
- Reproducible Python code download for any chart, so methods sections write themselves
- 300 DPI PNG, SVG, PDF export for journal submission
- $19.9/month, about half of BioRender's price
Try FigCanvas — Free · 30 free credits on your first day (then 18/day for your first 3 days, 10/day after) covers a few full figures. No BioRender-style "free plan blocks publication use" trap.
FAQ
What is scientific illustration software?
Scientific illustration software helps researchers create figures for papers, posters, and presentations — pathway diagrams, mechanism schematics, cell biology visuals, experimental workflows, and more. Traditional tools (BioRender, Mind the Graph) use icon libraries you drag onto a canvas. Newer AI-native tools (FigCanvas) generate the whole figure from a prompt.
What is the best scientific illustration software for researchers?
It depends on what you're making. For AI-generated figures across any scientific domain — pathway diagrams, mechanism illustrations, ML architecture figures, data charts — FigCanvas is the strongest option in 2026. For institutions already locked into BioRender with a large biomedical icon library, BioRender still has a role. For final vector polish before submission, Illustrator or Inkscape.
Is there a free scientific illustration tool?
Yes. FigCanvas has a free tier with 30 credits on your first day, 18 per day for the rest of your first 3 days and 10 per day after that, enough for a few full figures. Free exports include a small watermark, but publication rights are unrestricted. BioRender's free tier limits you to a small number of watermarked figures that can't be used in published work at all. Inkscape is fully free but requires manual illustration skills.
Can I use AI to make scientific illustrations for journals?
Yes, most major journals now accept AI-assisted figures as long as you disclose the tool used (typically in the figure caption or methods section). Always verify accuracy before submission — AI tools can occasionally mislabel structures. Treat the output as a draft.
What's the best BioRender alternative?
FigCanvas is the closest direct alternative for researchers who want to stop paying $39/month and stop dragging icons. It generates pathway diagrams, mechanism figures, and cell biology illustrations from text prompts, plus data charts on the same canvas — which BioRender doesn't do at all.
How much does scientific illustration software cost?
BioRender is $39/month for the academic plan. FigCanvas is $19.9/month. Mind the Graph starts around $25/month. Inkscape is free but you do all the drawing yourself. Illustrator is around $23/month and requires design expertise.
Is there a free or open-source BioRender alternative?
For free, FigCanvas has a publication-safe free tier and Inkscape is free forever. For strictly open source, Inkscape covers vector figures and matplotlib or D3 cover charts — but no open-source project currently matches BioRender's biomedical icon library. If your goal is to stop paying while keeping publication rights, a free AI-native tool is the practical answer; see the full BioRender alternative comparison.
Can FigCanvas replace BioRender for pathway and mechanism figures?
For most researchers, yes. FigCanvas generates pathway diagrams, mechanism schematics, and cell-biology illustrations directly from a prompt, and adds data charts on the same canvas. The one case where BioRender still wins is a lab already deep into its icon library and brand conventions — a familiarity argument rather than a capability one.