
Forest Plot Maker
for Meta-Analysis
Generate publication-ready forest plots from effect sizes and confidence intervals. Pooled estimates, subgroups, and log-scaled axes — no R, Stata, or RevMan required.
Upload your effect sizes
Drop a CSV or Excel table of study labels, effect sizes, and confidence intervals to generate a forest plot.
A forest plot generated from research data
What a researcher uploaded → what FigCanvas generated.
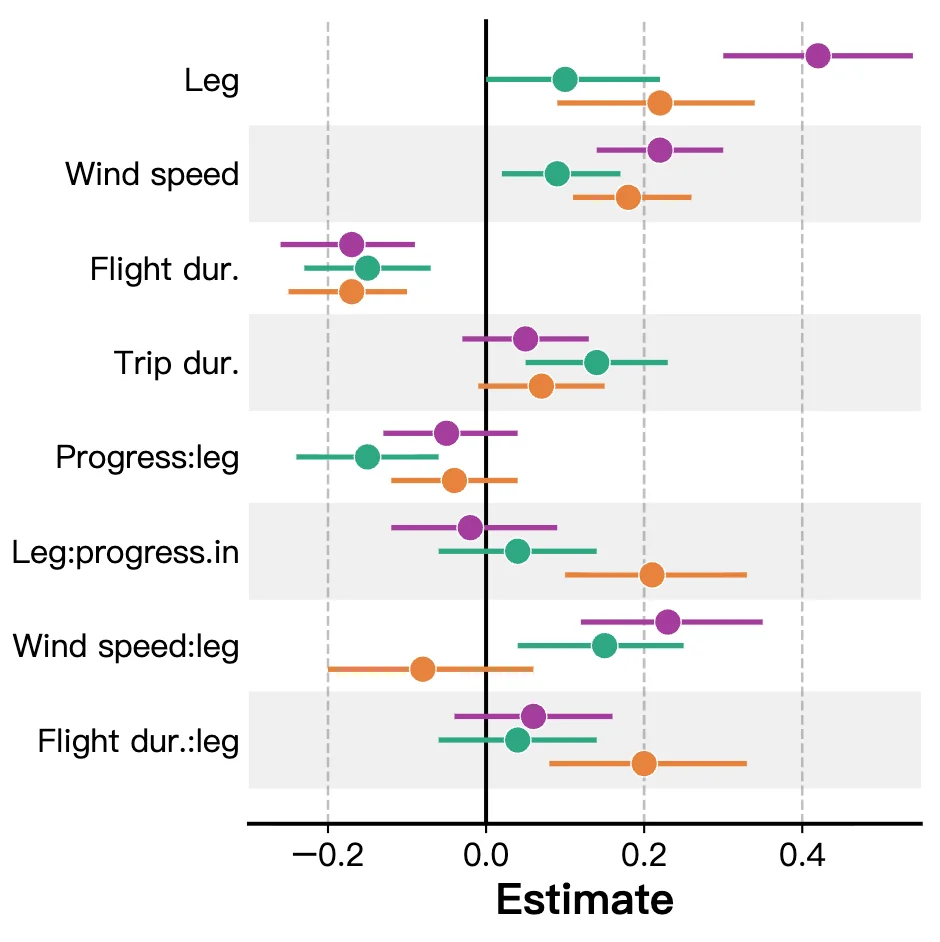
Coefficient estimates with confidence intervals
Each row shows a predictor's point estimate and confidence interval, aligned against a reference line at the null value. The same layout works for meta-analysis effect sizes, hazard ratios, and odds ratios — just change the effect measure and axis scale.
Create your own forest plot →Forest plot types FigCanvas can generate
From meta-analysis pooled estimates to regression coefficient plots, FigCanvas handles the full range of forest plot types used in research publications.
Meta-Analysis Forest Plots
Pool odds ratios, risk ratios, hazard ratios, or mean differences across studies, with per-study confidence intervals and a summary diamond.
Subgroup Analysis Plots
Stratify pooled effects by subgroup with grouped rows, subtotal diamonds, and heterogeneity annotations for each stratum.
Regression Coefficient Plots
Visualize coefficient estimates from linear, logistic, or Cox models with confidence intervals and a reference line at the null value.
Hazard Ratio Forest Plots
Display hazard ratios from survival and Cox proportional hazards models across covariates on a log scale, with clear reference lines.
Odds & Risk Ratio Plots
Plot odds ratios and risk ratios from clinical trials and cohort studies with log-scaled axes and significance annotations.
Custom Effect-Size Plots
Set your own effect measure, reference line, column labels, and study ordering, and highlight specific rows for publication and presentation.
How FigCanvas works
Go from effect sizes and confidence intervals to a publication-ready forest plot in four steps.
Upload effect sizes and intervals
Upload a CSV or Excel table with study labels, effect sizes (OR, RR, HR, or mean difference), and lower and upper confidence bounds. FigCanvas auto-detects the key columns.
Analyze and recommend a setup
FigCanvas inspects your data and suggests the right effect measure, axis scale (linear or log), reference line, and whether to pool a summary estimate.
Generate a publication-ready plot
Using research-focused visual defaults, FigCanvas creates a clean forest plot with aligned study rows, confidence-interval whiskers, a reference line, and an optional summary diamond.
Refine, vectorize, and export
Adjust labels, ordering, and styling, convert the figure into an editable vector graphic if needed, and export as SVG, PDF, or PNG.
Why FigCanvas for publication-ready forest plots
No R, Stata, or RevMan required
Skip the metafor, forestplot, or RevMan setup. Upload your effect sizes and FigCanvas draws the forest plot directly — the same figure you would build in code, without writing any.
Publication-ready output by default
Default styling follows common journal conventions for meta-analysis figures: aligned rows, a clear reference line, log or linear scaling, and a readable summary diamond.
Handles pooled and subgroup estimates
Show a single pooled effect or stratify by subgroup with subtotal diamonds, so the figure matches the structure of your systematic review or regression analysis.
Flexible export for papers, posters, slides
Export your forest plot as SVG, PNG, or PDF for manuscripts, posters, presentations, and journal submission. SVG output stays fully editable in Illustrator or Inkscape.
Forest plots for research workflows
Use FigCanvas to create forest plots for meta-analysis, clinical trial reporting, regression modeling, and scientific presentations.
For meta-analysis and systematic reviews
Pool effect sizes across studies, show per-study confidence intervals, and present the summary estimate as a forest plot ready for your review manuscript.
For clinical trial reporting
Visualize odds ratios, risk ratios, or hazard ratios across endpoints and subgroups with reference lines and significance annotations.
For regression and modeling papers
Turn coefficient estimates from logistic, linear, or Cox models into a clean forest plot that communicates effect direction and precision at a glance.
For posters and presentations
Export publication-ready forest plots for conference posters, slides, grant applications, and other research communication workflows.
Forest Plot Generator FAQs
A forest plot is a graph used in meta-analysis and systematic reviews to display effect sizes from multiple studies side by side. Each study is a row showing its point estimate and confidence interval, with a vertical reference line at the null value and often a summary diamond for the pooled effect.
You need a table with a study or variable label, an effect size (odds ratio, risk ratio, hazard ratio, or mean difference), and the lower and upper bounds of its confidence interval. Optionally, add weights or subgroup labels. FigCanvas accepts this as a CSV or Excel file and auto-detects the columns.
In R (metafor, forestplot) or Stata you write and debug code, then format the figure manually — often 30–60 minutes. FigCanvas generates the same forest plot in under a minute with no code, and you can then edit labels, ordering, scale, and colors interactively before exporting.
Yes. Provide the per-study effect sizes and intervals, and FigCanvas can display a summary diamond for the pooled estimate along with the individual study rows, matching the standard meta-analysis forest plot layout.
Yes. You can stratify rows into subgroups with subtotal diamonds, and plot hazard ratios or odds ratios on a log scale with a reference line at 1, as used in survival and clinical trial reporting.
Yes. FigCanvas exports at 300 DPI with publication fonts. SVG output is fully editable in Adobe Illustrator or Inkscape, so you can fine-tune the figure to match journal requirements.
Generate publication-ready forest plots from your data
Upload effect sizes and confidence intervals and create forest plots with pooled estimates, subgroups, and journal-ready styling — no coding required.