
PRISMA Flow Diagram
Generator
Paste your screening counts and AI draws the PRISMA 2020 flow diagram for you in seconds — no boxes to drag, no arrows to align. Then refine every count and label in the online editor before you export.
Try this sample prompt or write your own
PRISMA and study flow diagram examples
Screening funnels, participant flow, and allocation diagrams generated from plain-language prompts. Hover any figure to read and copy the prompt behind it.
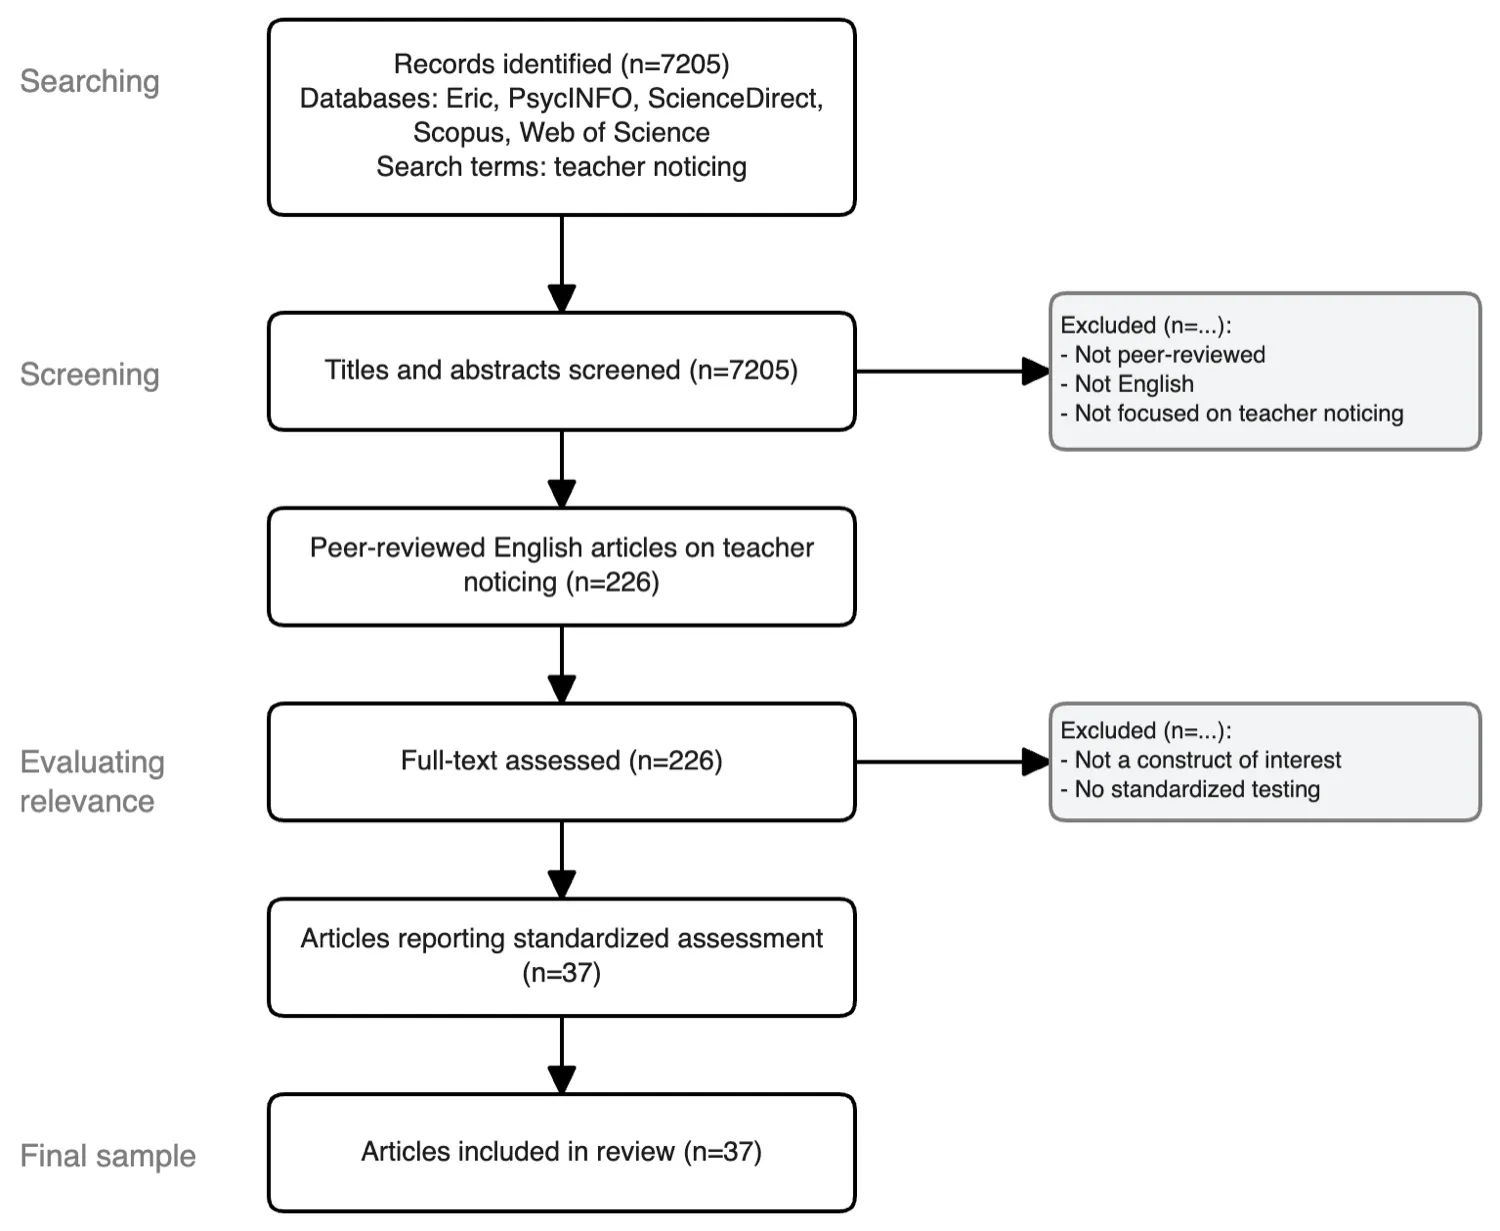
A vertical four-stage literature screening diagram for a scoping review on teacher noticing. Stage "Searching" starts with a box listing databases (Eric, PsycINFO, ScienceDirect, Scopus, Web of Science) and the search terms, ending with "Records identified (n=7205)". An arrow drops to stage "Screening", a box "Titles and abstracts screened (n=7205)", with a side arrow branching right to an exclusions box listing three reasons (not peer-reviewed, not English, not focused on teacher noticing). The spine resumes with "Peer-reviewed English articles on teacher noticing (n=226)". Stage "Evaluating relevance" contains "Full-text assessed (n=226)", another side exclusion for two reasons (not a construct of interest, no standardized testing), then "Articles reporting standardized assessment (n=37)". The final stage "Final sample" ends at "Articles included in review (n=37)". Stage labels appear as vertical tags on the left. Layout and composition are up to the agent. use template 33400 don't use mermaid
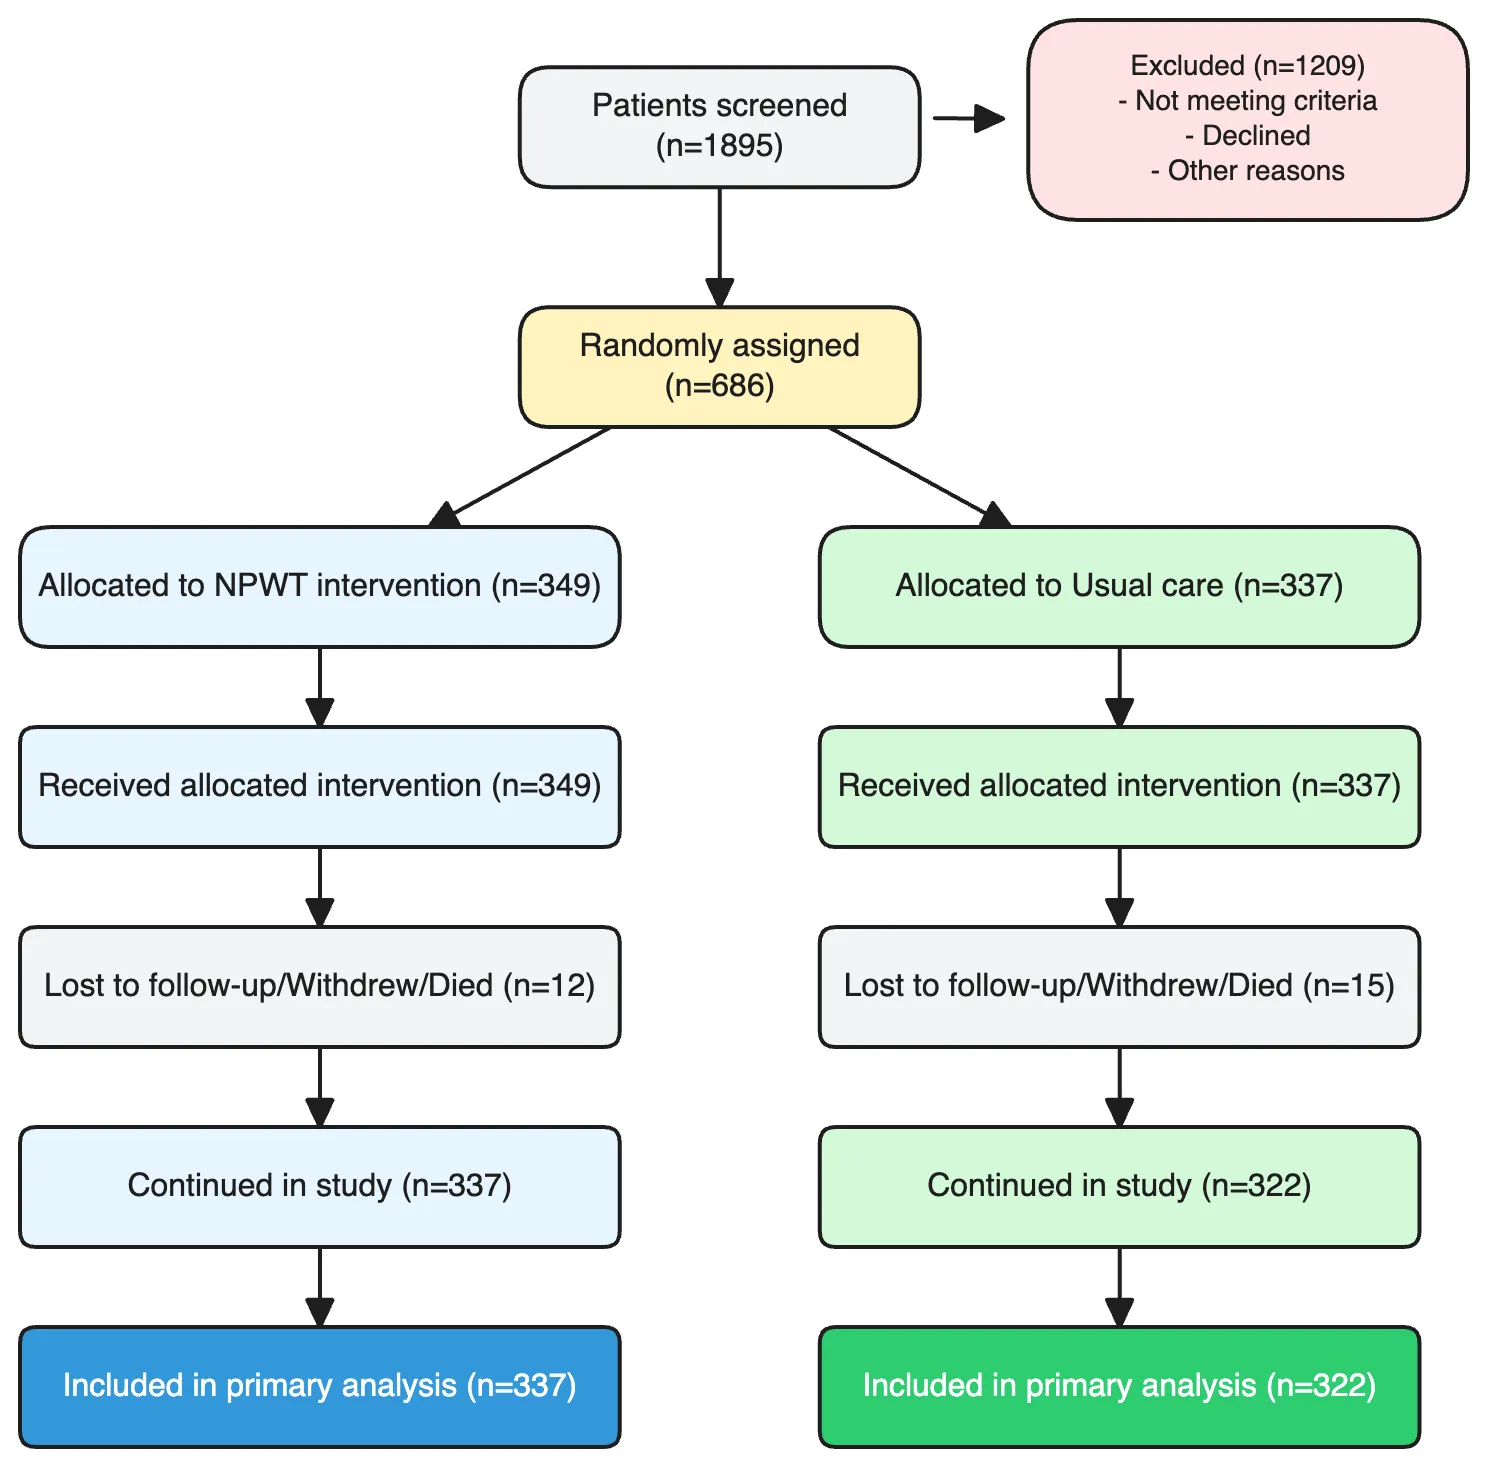
A CONSORT diagram tracking participants through a randomised wound-care trial. Start at the top with a node "Patients screened (n=1895)". An arrow drops down to a main spine; a side arrow branches right into an "Excluded (n=1209)" box that lists ineligibility reasons (not meeting age, wound, or consent criteria) and non-randomised cases. The spine continues to "Randomly assigned (n=686)". From there, two parallel branches split left and right into "NPWT intervention (n=349)" and "Usual care (n=337)". Each branch flows down through its own "Received intervention", "Withdrew or died during follow-up", "Continued in study", and finally "Included in primary analysis" boxes, with small side-notes for dropouts. Layout, spacing, and composition are up to the agent. Keep the two branches visually symmetric and the exclusion note clearly offset from the main spine. don't use mermaid
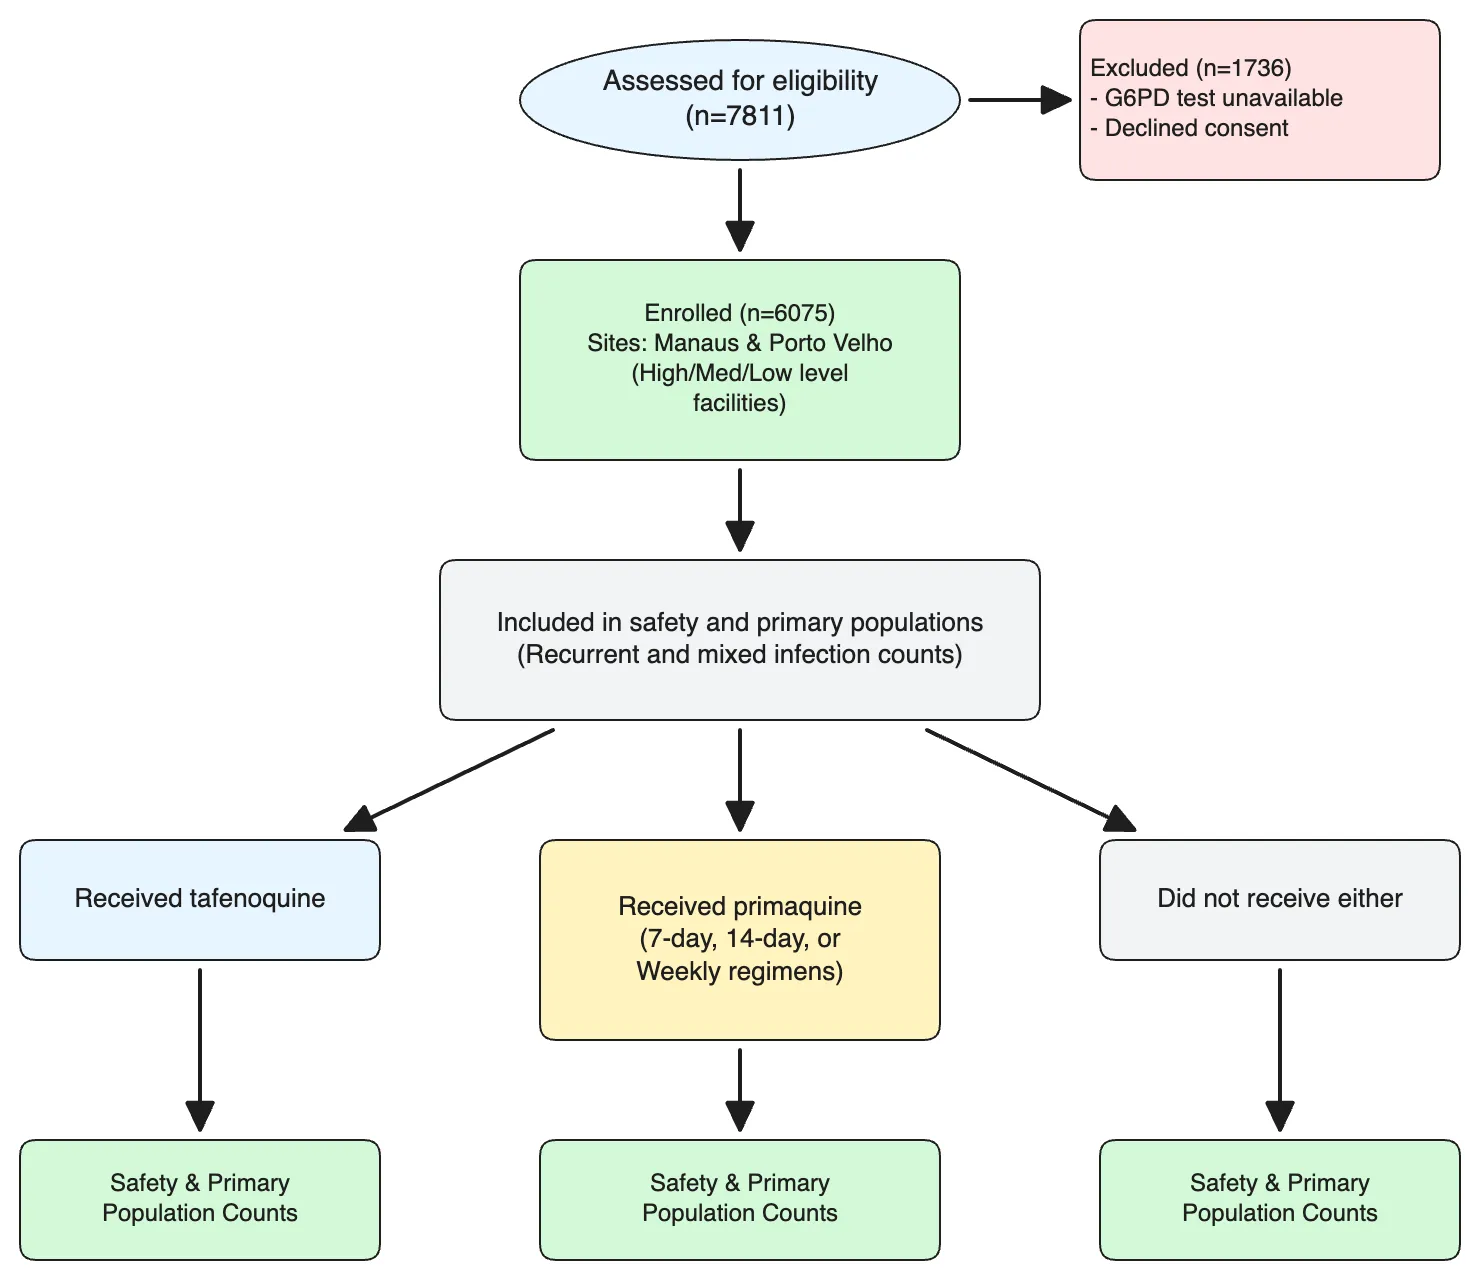
A top-down allocation flowchart for a retrospective antimalarial study. Start with "Assessed for eligibility (n=7811)". A side arrow branches right to "Excluded (n=1736)" with two sub-reasons (G6PD test unavailable, declined consent). The spine continues to "Enrolled (n=6075)", with small notes splitting enrolment across two sites (Manaus and Porto Velho, each further divided into high/medium-level and low-level health facilities). The next node is "Included in safety and primary populations", annotated with recurrent and mixed infection counts. From there, three parallel arrows branch into treatment groups: "Received tafenoquine", "Received primaquine", and "Did not receive either". The primaquine branch sub-splits into three regimens (7-day, 14-day, weekly). Each terminal group ends in a box summarising safety and primary-population counts. Layout and composition are up to the agent. Keep the three treatment branches clearly parallel. don't use mermaid
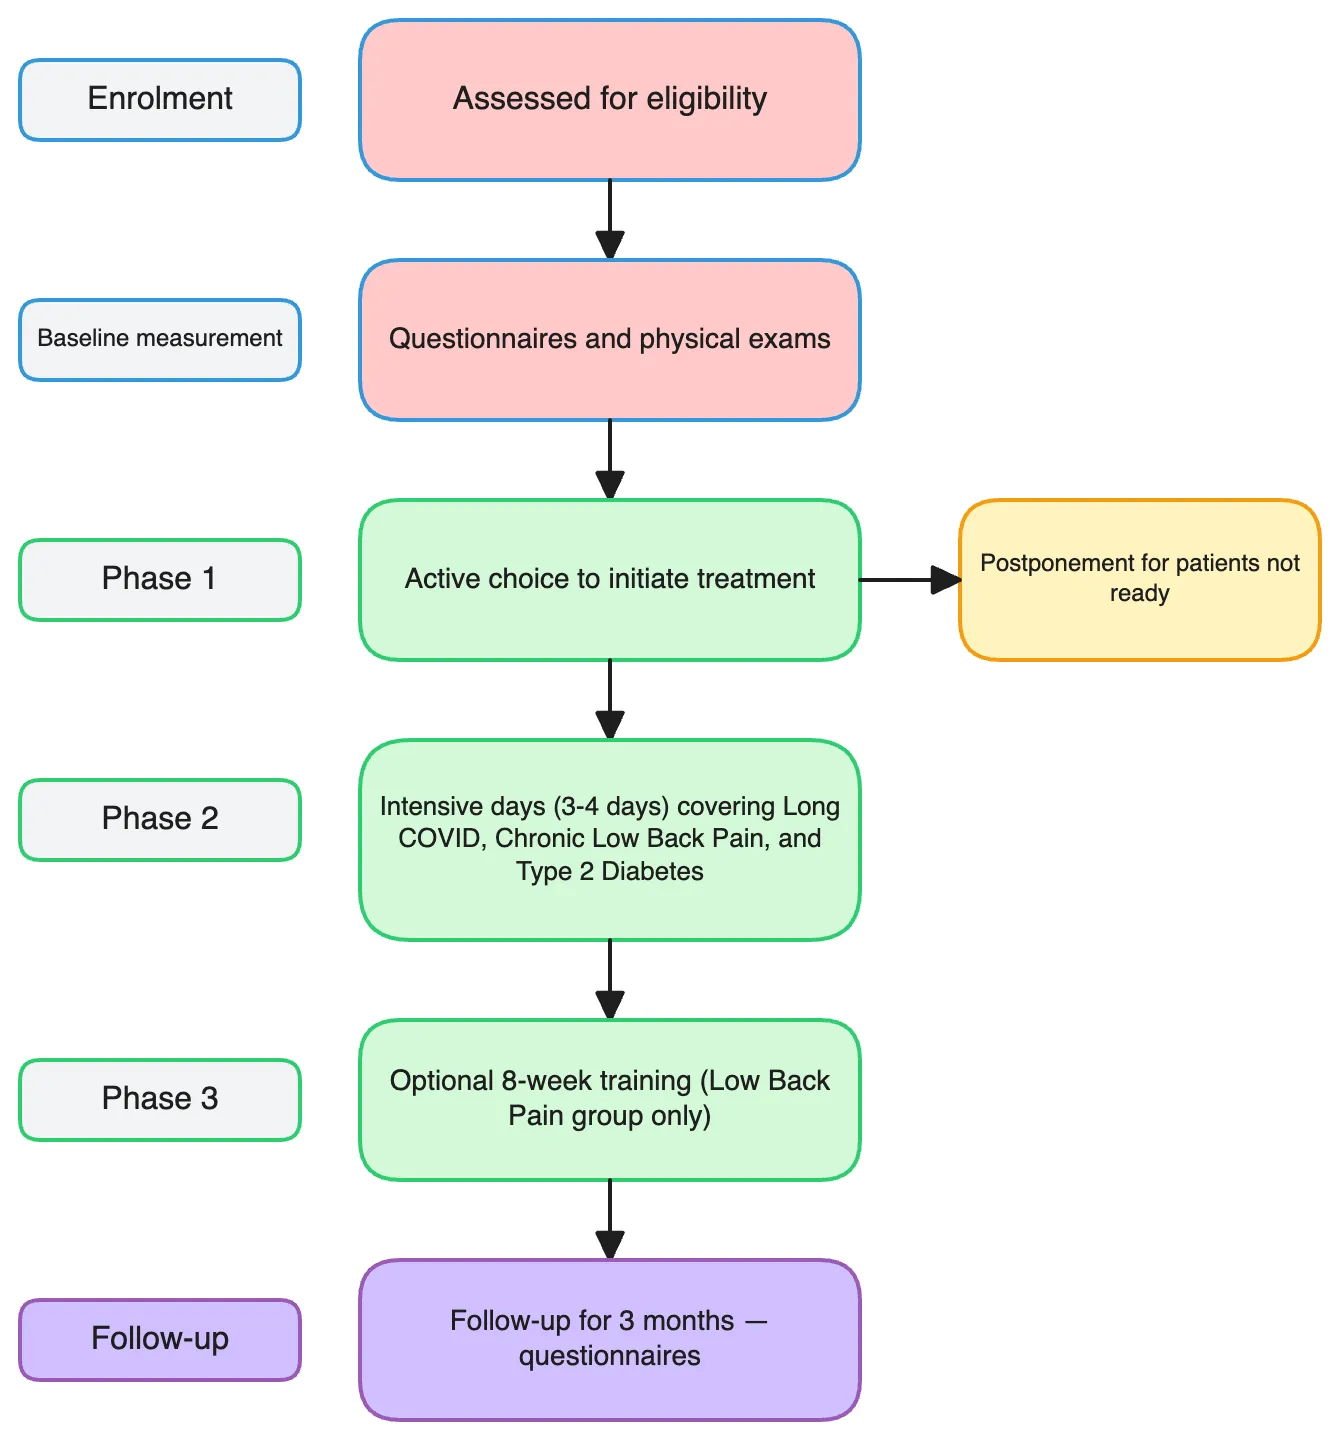
A vertical study-design flowchart for a pilot rehabilitation trial. The spine moves top-to-bottom through five labelled phases. "Enrolment" leads to "Assessed for eligibility", which feeds into "Baseline measurement" (questionnaires and physical exams). "Phase 1 — Preparing for change" captures an active choice to initiate treatment, with a small side branch for "Postponement for patients not ready". "Phase 2 — Concentrated group intervention" runs three or four intensive days covering long COVID, chronic low back pain, and type 2 diabetes cohorts. "Phase 3 — Integrating change into everyday life" notes optional eight-week training for the low-back-pain group. The spine ends at "Follow-up for 3 months — questionnaires". Each phase label sits in a small tag box next to its main step. Layout and composition are up to the agent. Keep the phase tags visually aligned with their main nodes. don't use mermaid
What goes into a PRISMA flow diagram
The generator covers the three PRISMA 2020 stages, the variants for other-source and scoping reviews, and the related study flow diagrams reviewers ask for.
Identification
Records identified from databases and registers, broken out per source, plus records removed before screening — duplicates, automation-flagged, and other reasons.
Screening
Records screened and excluded, reports sought for retrieval and not retrieved, then reports assessed for eligibility with exclusion reasons listed side by side.
Included
Studies included in the review and the number of reports attached to them — the terminal boxes reviewers and editors check first.
Other-sources variant
The two-column PRISMA 2020 layout for reviews that also search websites, organisations, and citation lists alongside databases and registers.
Scoping reviews
Scoping-review flow diagrams that follow the PRISMA extension, with charting and relevance-assessment stages instead of a strict eligibility funnel.
CONSORT & study flow
CONSORT participant flow, enrollment and allocation diagrams, and study design schematics — the same generator handles all of them.
How to make a PRISMA flow diagram
From screening counts to an AI-drawn, online-editable PRISMA 2020 diagram in three steps.
Start from the PRISMA template
Click the sample prompt to load a full PRISMA 2020 skeleton — identification, screening, and included stages with every standard box already named.
Let AI draw the diagram
Replace the example numbers with your own counts and hit Generate — AI lays out the boxes, arrows, and stage labels for you in seconds.
Edit online and export
Open the result in the online editor to fix a count, reword an exclusion reason, or adjust spacing — then export SVG, PNG, or PDF.
Why FigCanvas for PRISMA flow diagrams
AI does the drawing, in seconds
Describe your screening flow once and AI lays out every box, arrow, and stage label — what takes an hour of dragging shapes in Word or PowerPoint takes seconds here.
Built around the PRISMA 2020 structure
The template follows the identification, screening, and included stages the PRISMA 2020 statement describes, so the boxes reviewers look for are already there.
Edit everything online
Open the generated diagram in the browser-based editor to fix a count, reword an exclusion reason, or nudge spacing — no desktop software, no regenerating from scratch.
Export at journal quality
Export your PRISMA flow diagram as SVG, PNG, or PDF for manuscript submission, supplementary material, protocol registration, and slides.
PRISMA diagrams across the review lifecycle
Draft the flow at protocol stage, finalise it after screening, and regenerate it when reviewers ask for a recount.
For systematic reviews and meta-analyses
Produce the flow diagram journals expect alongside a PRISMA checklist, with every screening stage and exclusion reason accounted for.
For scoping and rapid reviews
Adapt the stage labels for scoping reviews, rapid reviews, and evidence maps where the screening funnel differs from a standard review.
For protocol registration and grant applications
Draft the expected screening flow while writing a PROSPERO registration or a funding proposal, then update the counts once screening finishes.
For revisions and updated reviews
Regenerate the diagram when a reviewer asks for a recount, or when an updated search adds records on top of a previously published review.
PRISMA Flow Diagram FAQs
A PRISMA flow diagram is the standard figure in a systematic review that shows how many records were identified, screened, excluded, and finally included, together with the reasons for exclusion at the full-text stage.
Yes. The built-in template follows the PRISMA 2020 structure — identification, screening, and included — including the boxes for records removed before screening, reports sought for retrieval, and reports excluded with reasons. You can also adapt it to the 2009 layout if a journal still asks for it.
The 2009 diagram used four stage labels — identification, screening, eligibility, and included. PRISMA 2020 uses three (identification, screening, included), separates records from reports, and adds explicit boxes for records removed before screening and for reports that could not be retrieved.
A complete PRISMA 2020 diagram is usually drawn in well under a minute. You paste your counts, hit Generate, and AI handles the boxes, arrows, and stage labels — the slow part of making the figure by hand.
You paste them once. Load the sample prompt, replace the example numbers and exclusion reasons with your own, and generate. There is no spreadsheet upload step — the counts live in the prompt, so they are easy to revise later.
Yes. The diagram opens in FigCanvas’s online editor, where you can correct a single count, reword an exclusion reason, or adjust box spacing directly in the browser — no desktop software and no starting over.
You can export the PRISMA flow diagram as SVG, PNG, or PDF. SVG and PDF stay sharp at any size, which is what most journals prefer for line-art figures.
Yes. CONSORT participant flow diagrams, enrollment and allocation diagrams, and other study flow schematics use the same generator — describe the arms and counts instead of the screening stages.
You can start for free with daily credits, generate diagrams, and export them. No diagramming software or drawing skills are required.
Let AI draw your PRISMA flow diagram in seconds
Load the PRISMA 2020 template, paste your screening counts, and let AI do the drawing — then polish every box in the online editor and export.