
AI tools for scientific figures & research
Browse 20 AI tools for scientific figures, free to start. Generate illustrations, graphical abstracts, flowcharts, PRISMA diagrams and data plots from a prompt or a dataset, then refine them on one canvas and export as SVG, PDF or PNG.
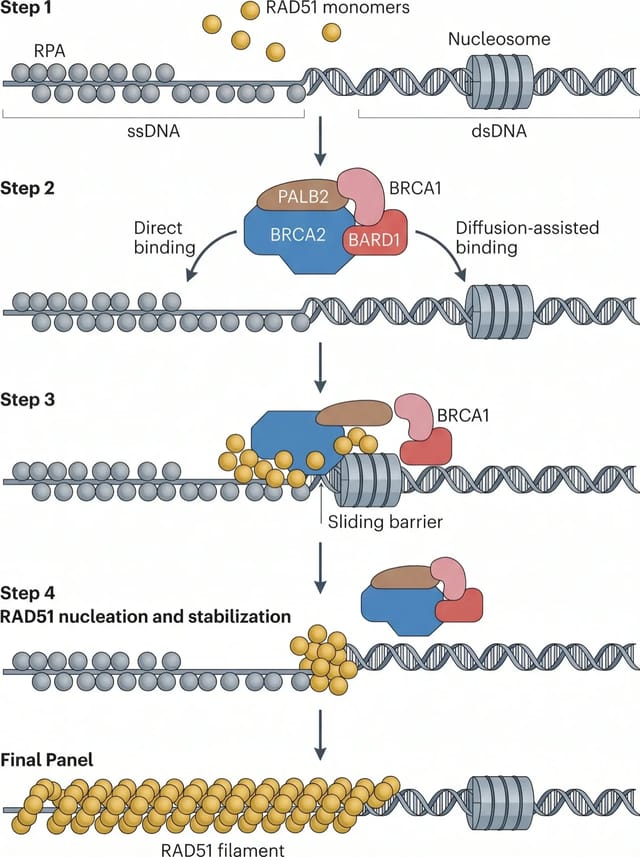
AI Scientific Illustration Maker
Pathway diagrams, cell biology figures and mechanism illustrations drawn from a plain-text description.
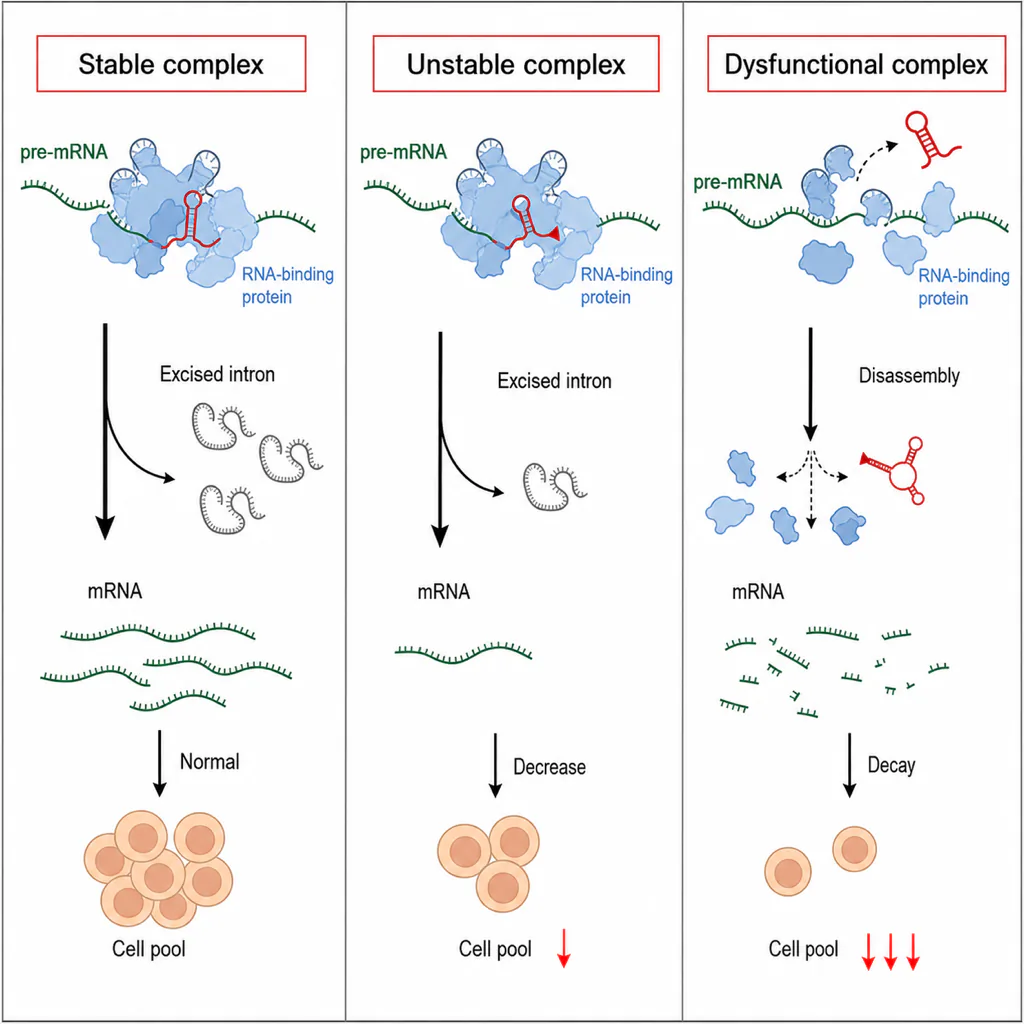
AI Graphical Abstract Maker
Journal-ready graphical abstracts for Cell, Nature, Elsevier and ACS submissions.
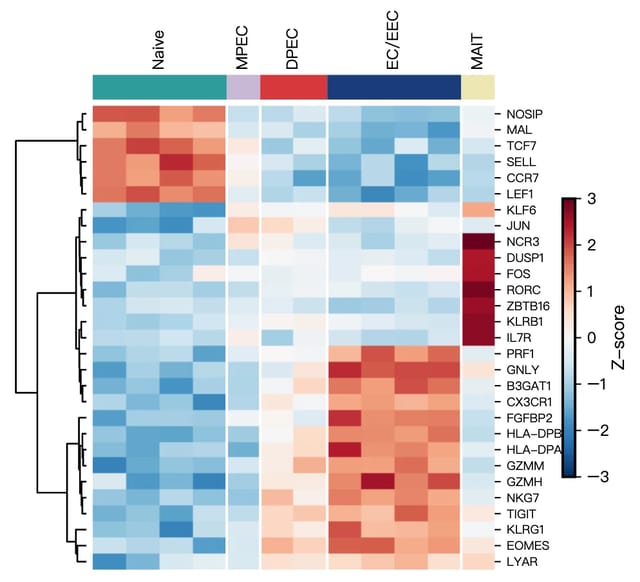
Scientific Data Visualization
Heatmaps, PCA, violin and bar charts for researchers, generated from CSV or Excel data.
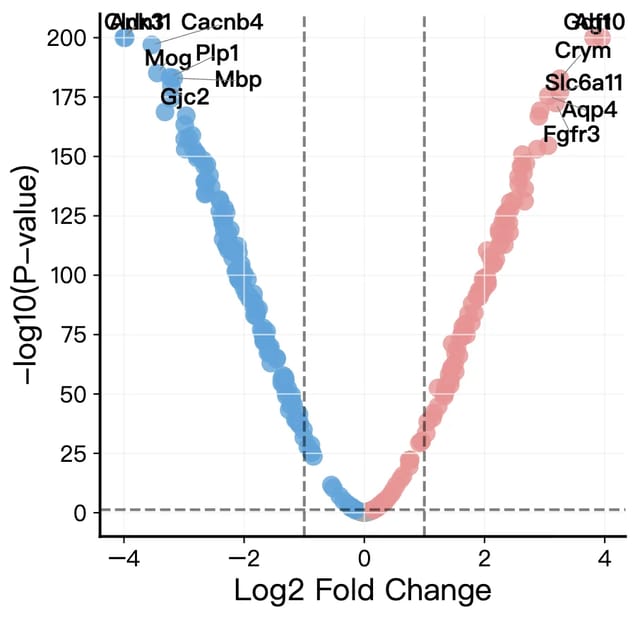
Volcano Plot Maker
Volcano plots for RNA-seq, proteomics and GWAS results with labeled genes and significance thresholds.
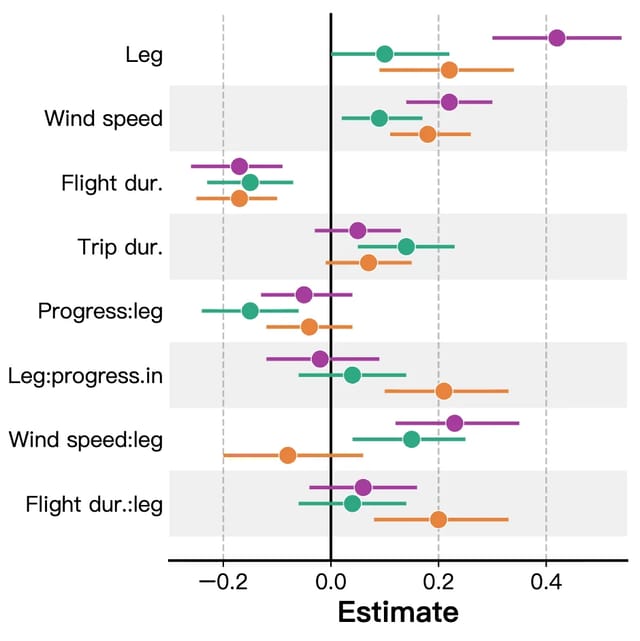
Forest Plot Generator
Forest plots for meta-analysis, systematic reviews and regression results with confidence intervals.
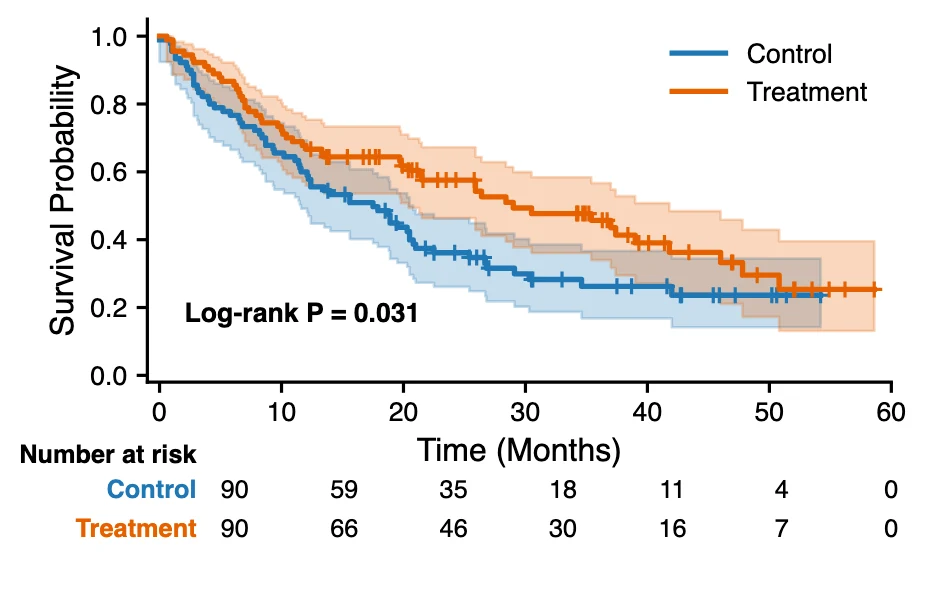
Kaplan-Meier Curve Generator
Kaplan-Meier survival curves with censoring marks, log-rank test and a number-at-risk table from time-to-event data.
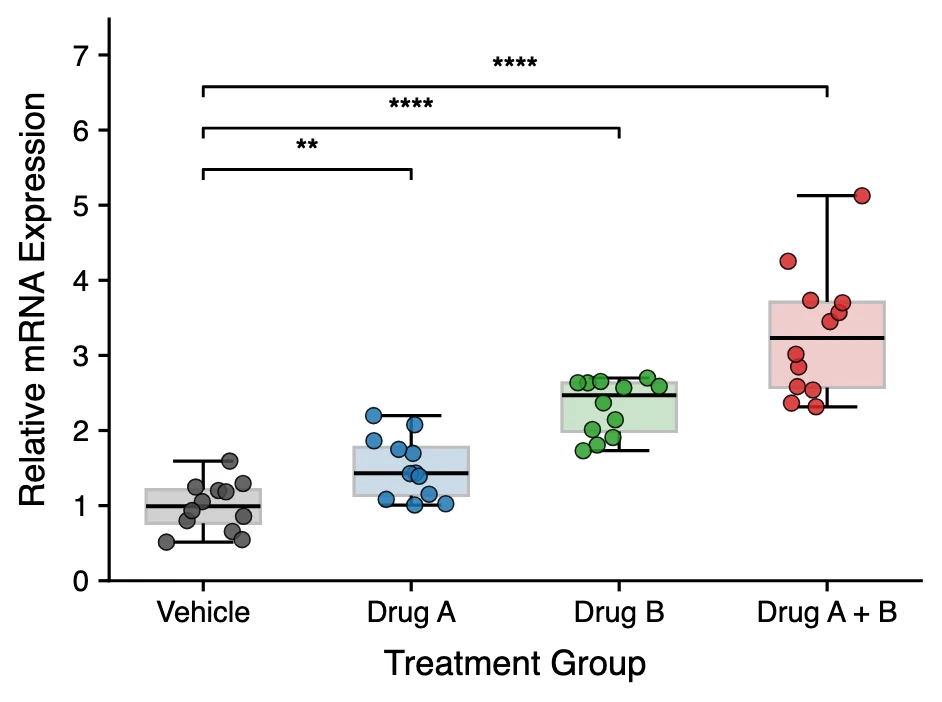
Box Plot Maker
Box and whisker plots with individual data points and significance brackets computed from your data.
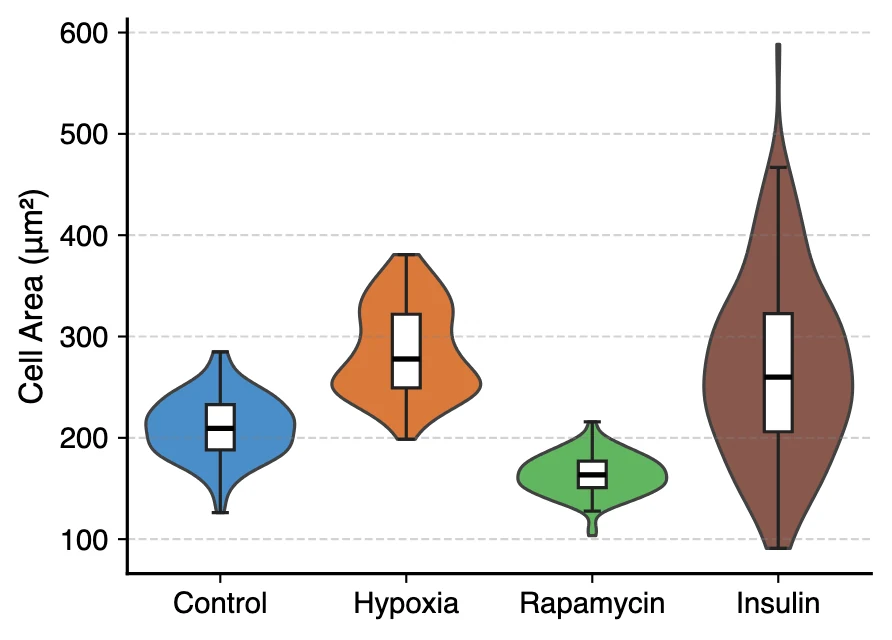
Violin Plot Maker
Violin plots with embedded box plots, split violins and stacked violins for single-cell marker genes.
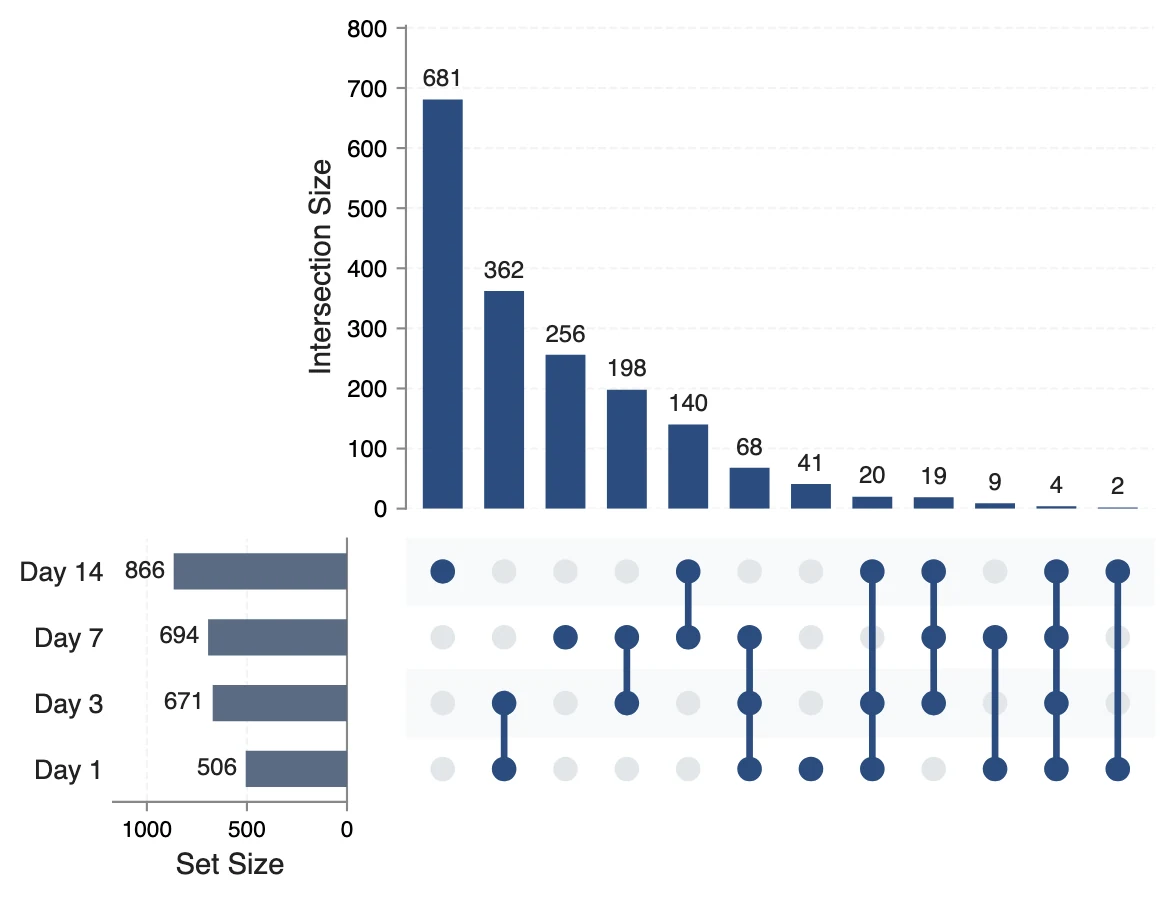
UpSet Plot Generator
UpSet plots of gene lists, variant calls or any sets, for overlaps a Venn diagram cannot show.
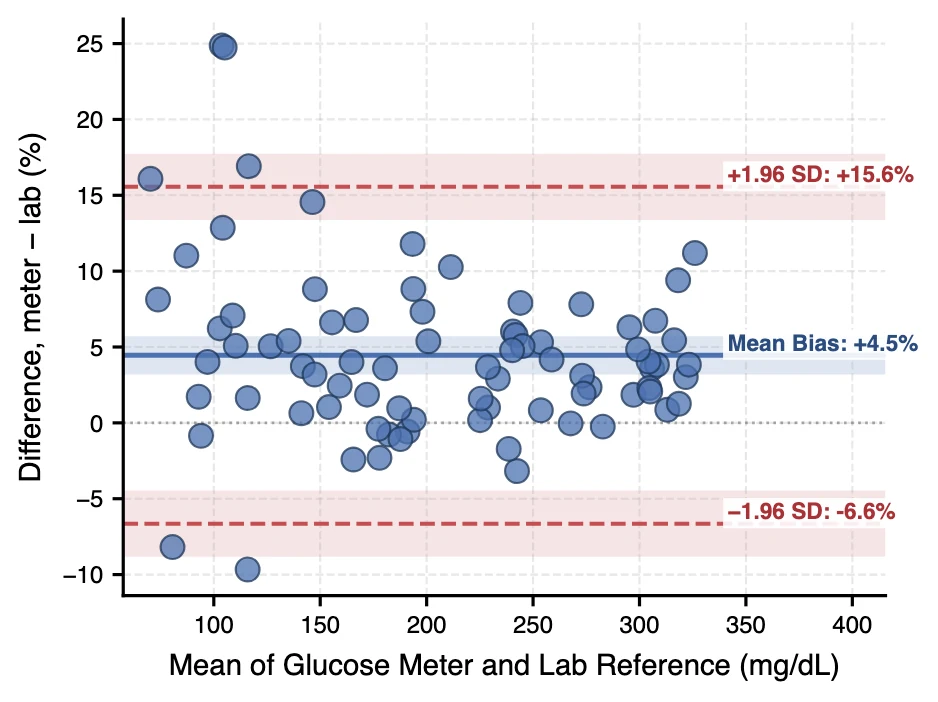
Bland-Altman Plot Generator
Bland-Altman difference plots with bias and 95% limits of agreement for method comparison studies.
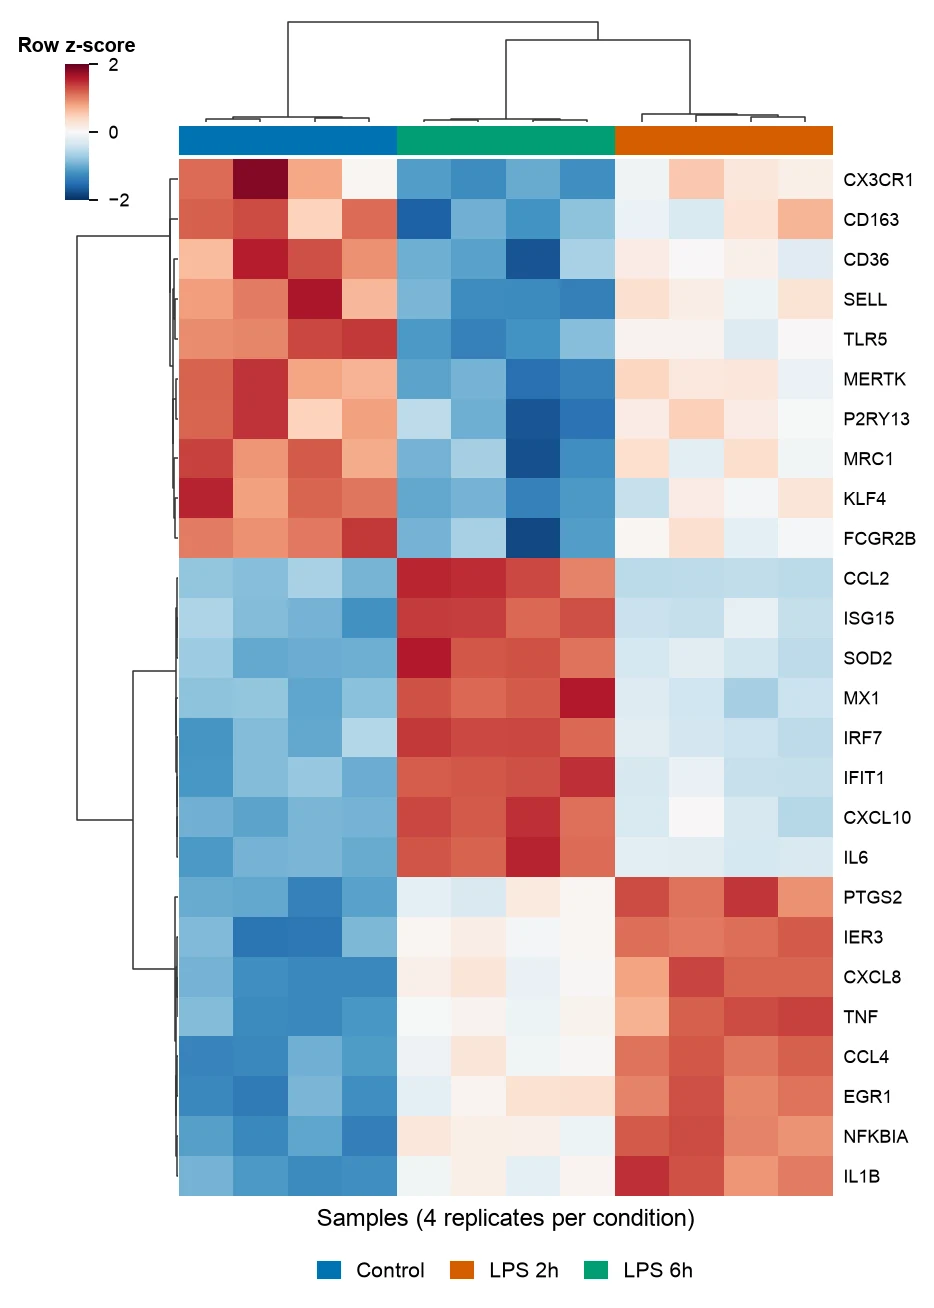
Heatmap Generator
Clustered gene expression heatmaps with z-scored rows and dendrograms, and correlation heatmaps of any numeric table.
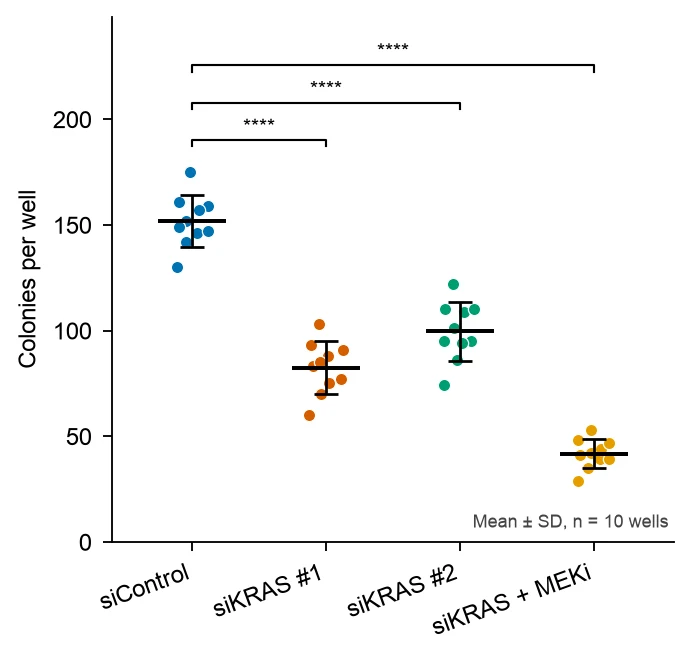
Dot Plot Generator
Dot plots that show every data point with mean or median and error bars, and bubble dot plots of marker genes across clusters.
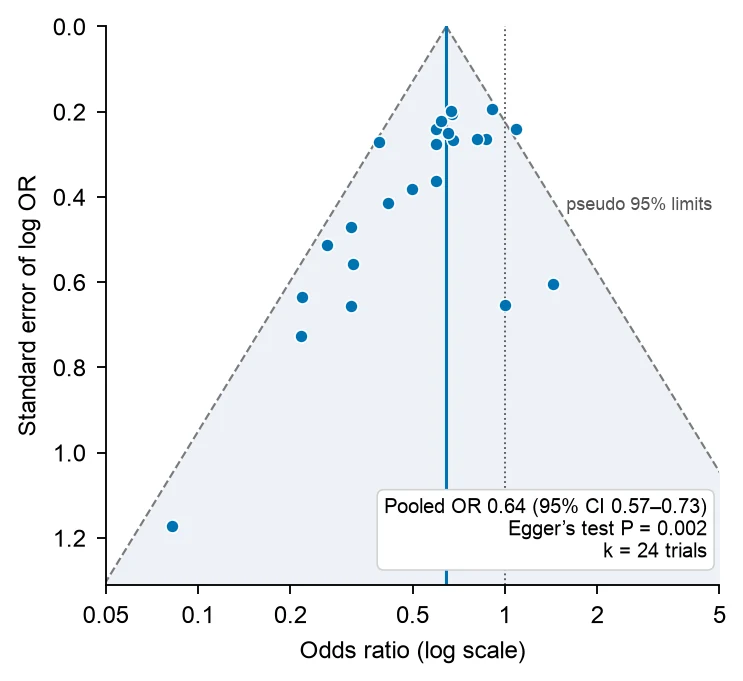
Funnel Plot Generator
Funnel plots of study effect sizes against standard error with pseudo 95% limits and Egger’s test, for meta-analyses and systematic reviews.
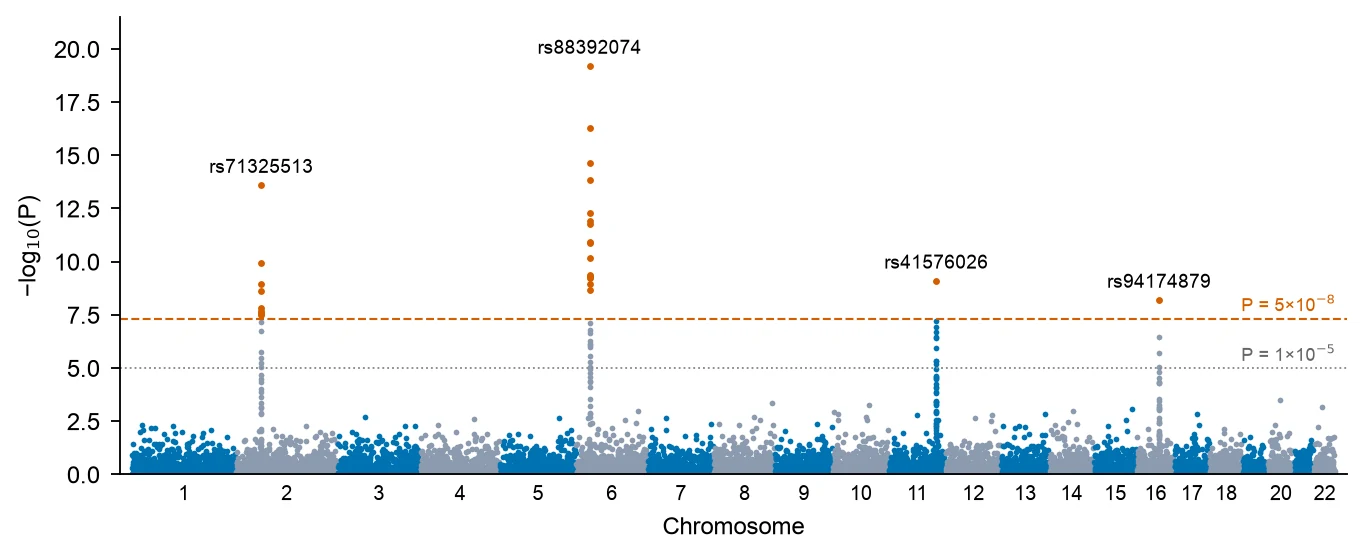
Manhattan Plot Generator
Manhattan plots of GWAS summary statistics with genome-wide significance lines and labeled top hits, plus a QQ plot with genomic inflation.
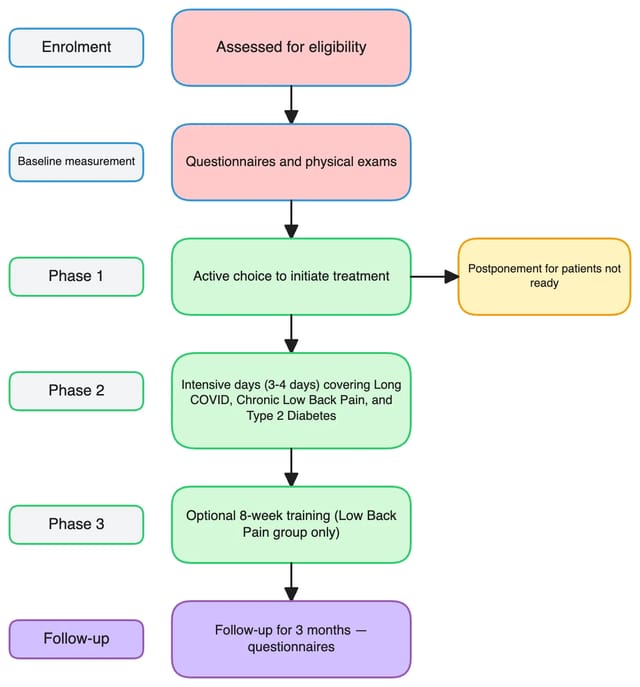
Scientific Flowchart Maker
Experimental workflows, study design diagrams and analysis pipelines for research papers.
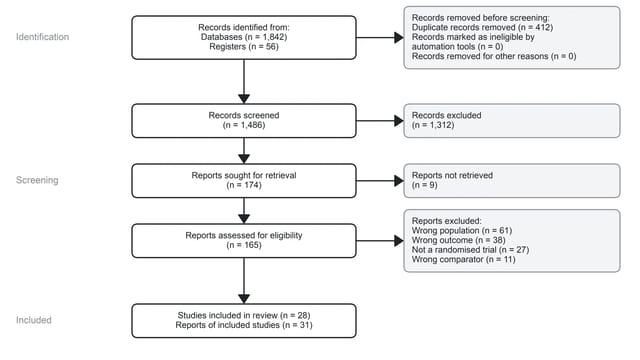
PRISMA Flow Diagram Generator
PRISMA 2020 flow diagrams for systematic reviews and meta-analyses, drawn from your screening counts.
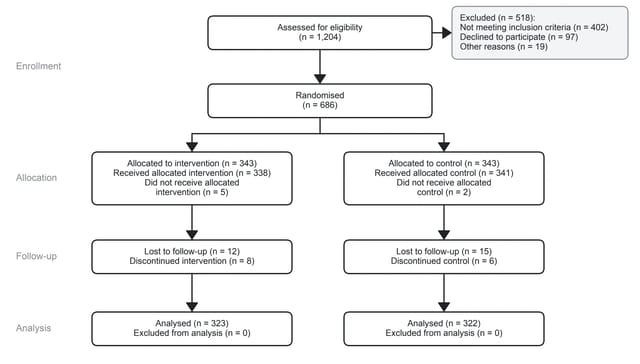
CONSORT Flow Diagram Generator
CONSORT 2025 participant flow diagrams for randomised controlled trials, drawn from your enrolment, allocation and follow-up counts.
Scientific Color Palette Generator
Okabe-Ito, Viridis, ColorBrewer and Nature, Science, Cell and PNAS palettes for plots, diagrams and multi-panel figures.
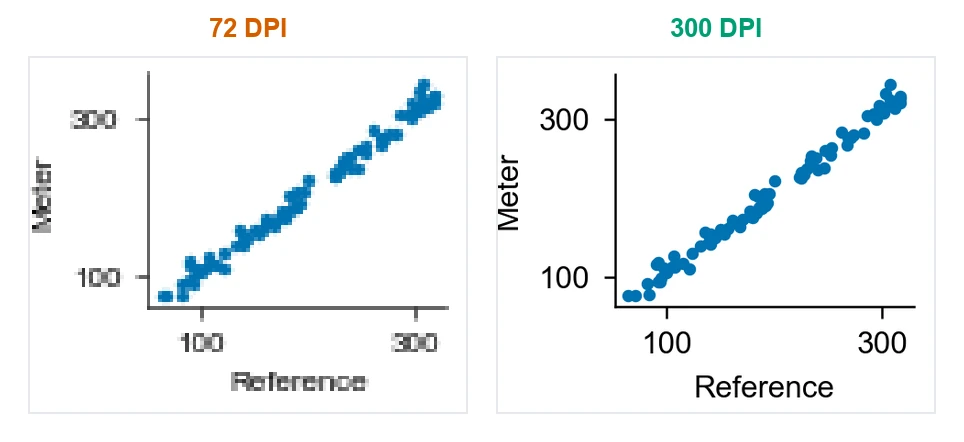
Image DPI Converter
Check an image’s DPI and change it to 300, 600 or 1000 for journal submission, with PNG, JPEG and TIFF output.
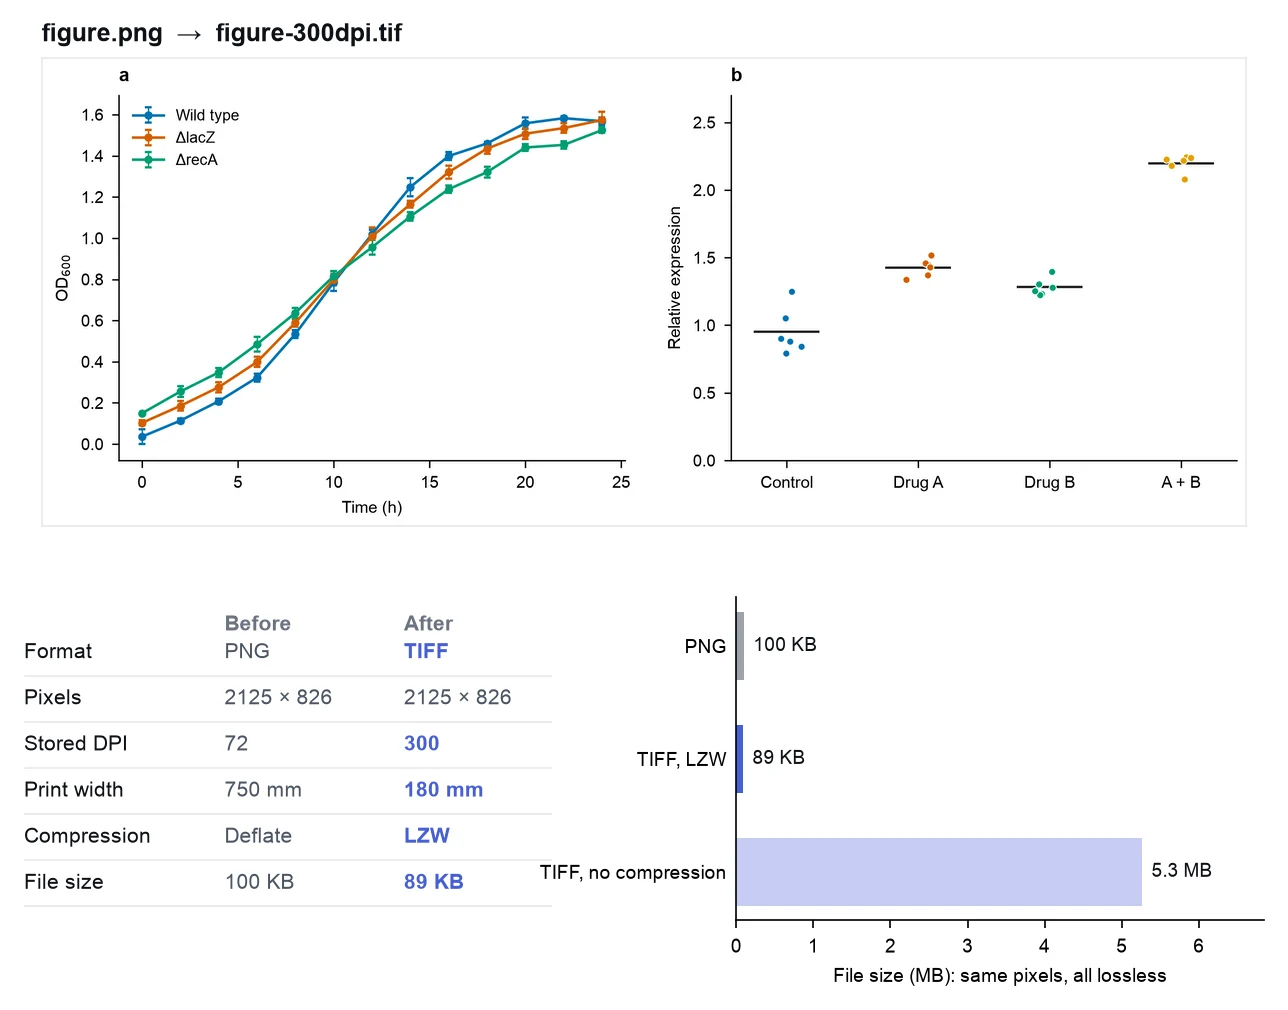
PNG to TIFF Converter
Convert PNG or JPEG figures to LZW-compressed TIFF at 300, 600 or 1000 DPI for journal submission, without uploading the file.
Fig. 01 — Figures & Illustrations · 2 tools
Scientific figures and illustrations
Use the illustration maker when the figure explains a mechanism, pathway or experimental setup inside the paper. Use the graphical abstract maker when you need the single summary image a journal shows next to the abstract: it starts from a problem-method-result layout and keeps to the journal’s size limits.
Fig. 02 — Plots & Charts · 12 tools
Publication-ready plots from your data
Start with the general data visualization tool for heatmaps, PCA and bar charts from a CSV or Excel file. The dedicated plot pages are the same engine with the conventions of their field built in: log2 fold change thresholds for volcano plots, pooled estimates for forest plots, log-rank tests and at-risk tables for Kaplan-Meier curves, limits of agreement for Bland-Altman plots, and exclusive intersections for UpSet plots. Use the box or violin plot maker for group comparisons.
Fig. 03 — Diagrams & Flowcharts · 3 tools
Diagrams and flowcharts from your methods
The flowchart maker turns a written protocol into an experimental workflow, study design or analysis pipeline diagram. For a systematic review, use the PRISMA generator instead: it already knows the PRISMA 2020 boxes, so you only enter the record counts at each stage.
Fig. 04 — Colors · 1 tool
Colorblind-safe palettes for figures
Pick a palette here before you finalize any figure above. Okabe-Ito is the safe default for categorical data; Viridis for continuous scales; the journal presets match the look of Nature, Science, Cell and PNAS. The palette is applied to the editable figure, so every panel of a multi-panel figure stays consistent.
Fig. 05 — Figure Prep · 2 tools
Get figures through journal checks
Use these free utilities on any figure, including ones made outside FigCanvas, before uploading to a submission portal. The DPI converter checks the resolution a journal will see, fixes a 72 DPI label without touching the pixels, and exports TIFF when the portal asks for it.
Every tool opens the same infinite canvas
A volcano plot, a pathway illustration and a study flowchart can sit side by side as panels of one figure. Vectorize any panel to edit its text and shapes, apply one palette across all of them, and export the composition at 300 DPI.
How-to guides for each kind of figure
- Scientific Illustration Software: What to Actually Use in 2026Guide
- How to Make a Graphical Abstract for a Research PaperGuide
- How to Make a Volcano Plot in 3 Minutes (No R, No Python)Guide
- Okabe-Ito Palette HEX Codes for Scientific FiguresReference
- BioRender Alternative for AI Scientific FiguresComparison
Scientific figure tools FAQ
Most researchers combine three kinds of tool: an illustration tool for mechanisms and pathways, a plotting tool for data, and a diagram tool for workflows and reporting charts such as PRISMA or CONSORT. FigCanvas covers all three in one canvas with 20 tools, so a volcano plot, a pathway illustration and a study flowchart can be assembled as panels of a single figure.
Yes. Every tool on this page can be used with free daily credits and no credit card. Free exports are PNG with a watermark. The Pro plan removes the watermark and adds editable SVG and 300 DPI PDF export, which is what most journals ask for.
FigCanvas is a free-to-start alternative for scientific illustrations and graphical abstracts. Instead of dragging icons from a library, you describe the figure and edit the generated draft. Unlike BioRender, data plots and flowcharts live on the same canvas as the illustration. See the BioRender alternative comparison linked above for the details.
Yes. Pro exports are real vector SVG and PDF files, so text, shapes and colors stay editable in Adobe Illustrator, Inkscape, Affinity Designer and PowerPoint. PNG exports are available on every plan for slides and drafts.
The data visualization, volcano plot and forest plot tools accept CSV, TSV and Excel (xlsx) files, or values pasted directly from a spreadsheet. Column names are detected automatically and you can map them to axes, groups and labels before plotting.
Yes. Every tool opens the same canvas. Generate a plot, an illustration and a flowchart as separate cards, arrange them into a frame with panel labels, apply one color palette to all of them, and export the whole frame as a single SVG, PDF or PNG.
Start with the figure you need today
Free daily credits, no card needed. Pick a tool above or sign up and describe your figure.