
Dot Plot Generator that shows every data point
Upload your measurements and this dot plot generator draws every data point with the mean ± SD or the median, plus P values computed from your data. It also makes bubble dot plots of marker genes across single-cell clusters. No Prism, R or Python required.
Free account · daily credits included · no credit card
Example result · reference figure drawn from this sample data
Dot plot examples
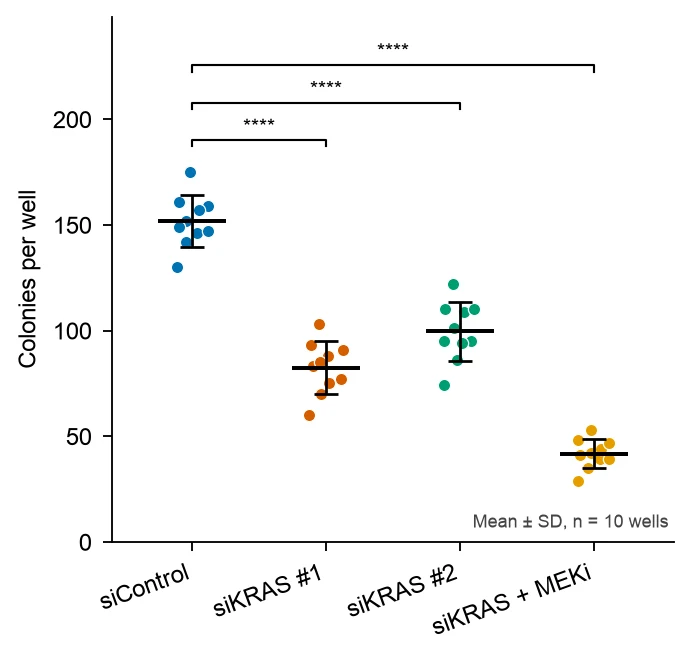
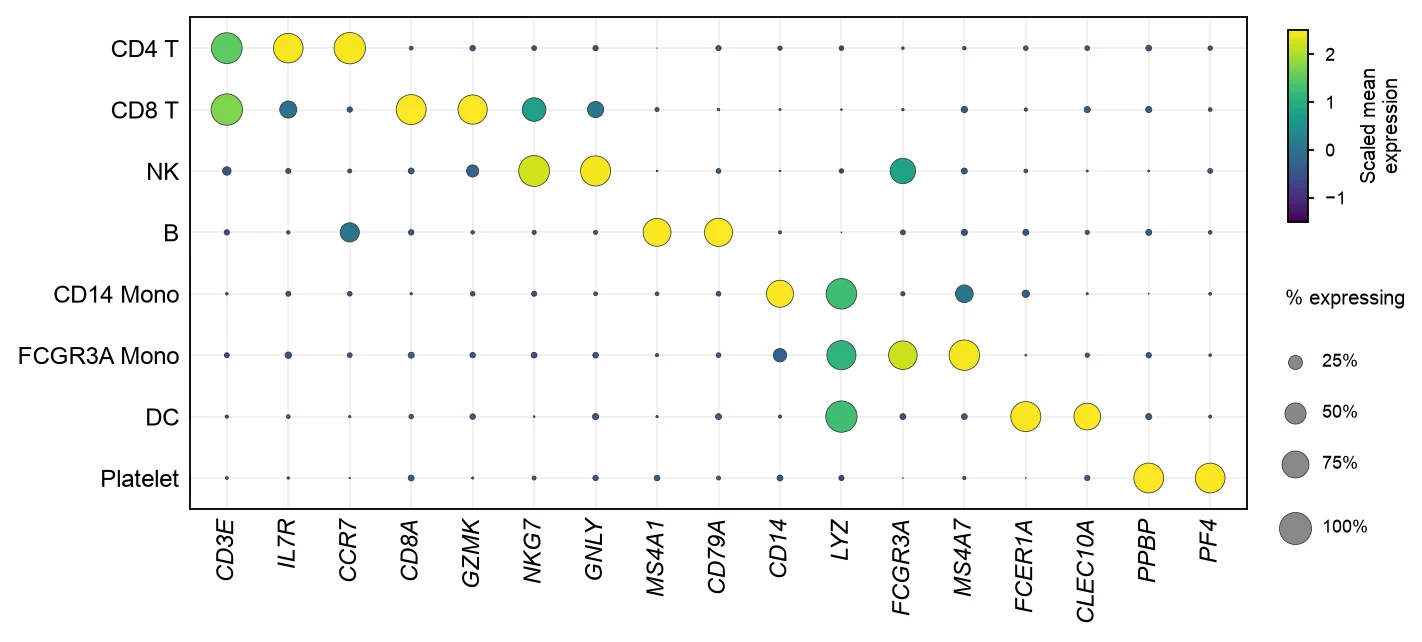
These are reference figures drawn from the sample datasets above (simulated data) to show what each prompt asks for. In the colony assay, with 10 wells per condition, siControl averages 151.8 ± 12.2 colonies per well, siKRAS #1 82.5 ± 12.4, siKRAS #2 99.6 ± 13.8 and siKRAS + MEKi 41.7 ± 6.8 (mean ± SD); Welch’s t-test against siControl gives P < 0.0001 for all three. The bubble dot plot shows 17 marker genes across 8 PBMC clusters; each cluster’s own markers are expressed in 74% to 97% of its cells.
What a dot plot shows
“Dot plot” names three different figures. In lab biology it usually means a column scatter plot: every measurement as a dot, grouped by condition, with the mean ± SD or the median on top. In statistics teaching it means a frequency dot plot, where stacked dots count how often each value occurs. In single-cell genomics it means a bubble dot plot of genes across cell clusters. This dot plot maker draws all three.
Every data point with mean ± SD
A dot plot of individual values shows the sample size, the spread, outliers and any bimodal pattern, all of which a bar chart hides. A horizontal line marks the mean or median and error bars mark the SD, SEM or confidence interval.
It works best for small to moderate samples, roughly 3 to 50 points per group. With hundreds of points per group, a box plot or violin plot with the points overlaid is easier to read.
Frequency dot plot
A frequency dot plot puts values on one axis and stacks one dot per observation above each value or bin, like a histogram made of dots. Leland Wilkinson described the method for placing the dots in The American Statistician in 1999.
It suits small data sets of whole numbers, such as quiz scores, litter sizes or counts of events, where every observation should stay visible.
Bubble dot plot of marker genes
In single-cell RNA-seq, a dot plot summarizes many genes across many clusters in one grid. Dot size is the percentage of cells in the cluster that express the gene, and dot color is the average expression, usually scaled per gene so each gene uses the full color range.
It is the standard figure for showing that each cluster expresses its expected markers, for example MS4A1 and CD79A in B cells or CD14 and LYZ in classical monocytes. Seurat’s DotPlot and Scanpy’s sc.pl.dotplot draw it from a single-cell object; FigCanvas draws it from a summary table.
Mean ± SD, mean ± SEM or median
SD describes how spread out the individual values are; SEM (SD divided by √n) describes how precisely the mean is estimated. With 10 points per group the SEM is about a third of the SD, so state which one the error bars show.
For skewed data or small samples with outliers, show the median with the interquartile range instead, and use a non-parametric test such as Mann-Whitney.
How to lay out data for a dot plot
Use one row per measurement in long format. Two columns are enough for a group comparison; FigCanvas detects them by name and content, and you can confirm the mapping before plotting.
- group
- Condition, treatment, genotype or time point. The order of first appearance sets the order on the x-axis unless you ask for another.
- value
- The measurement for that replicate, animal or well. One numeric column.
- gene, cluster, avg_log_expression, pct_expressed
- For a bubble dot plot: one row per gene and cluster with the average expression and the percentage of cells expressing it.
| condition | well | colonies |
|---|---|---|
| siControl | 1 | 175 |
| siControl | 2 | 161 |
| siKRAS #1 | 1 | 75 |
| siKRAS + MEKi | 1 | 42 |
Have one column per group, as in a Prism column table? Upload it as it is; FigCanvas reshapes wide tables into long format before plotting.
How to make a dot plot with FigCanvas
Go from raw measurements to a publication-ready dot plot in four steps.
Upload your measurements
Upload a CSV or Excel file with a group and a value column, or a gene-by-cluster summary table, or load one of the sample datasets.
Confirm columns and statistics
FigCanvas identifies the group and value columns and proposes the summary (mean ± SD, mean ± SEM or median) and a test such as Welch’s t-test or ANOVA with a post hoc test.
Generate the figure
Summary statistics and P values are computed from your data in Python (SciPy, statsmodels and scikit-posthocs are preinstalled) and drawn with journal-style defaults and colorblind-safe colors.
Refine and export
Change the group order, error bars, colors or comparisons by asking in plain language, then export SVG, PDF or PNG for the manuscript.
Why researchers make their figures with FigCanvas
Every point visible
Each replicate is drawn as its own dot, spread sideways so that equal values do not hide each other, which is what reviewers ask for instead of bar charts.
P values computed, not typed
Means, SDs and test results are calculated by Python code run on your data, and the brackets and stars are placed from those results.
Bubble dot plots without Seurat
Upload a gene-by-cluster summary table and get the size and color encodings, legends and italic gene names without loading a single-cell object.
Editable vector export
Export SVG or PDF and adjust fonts, point sizes or panel layout in Illustrator or Inkscape to match the journal’s figure guidelines.
Dot plot FAQs
Yes. The FigCanvas dot plot generator plots every data point by group with the mean ± SD or the median, from a CSV or Excel file and a description in plain language, and adds computed P values. You can sign up for free and make dot plots with the free daily credits.
Yes. FigCanvas makes the same scatter dot plot with mean and SD from a table copied out of Prism (one column per group), runs the statistics and adds P values, without a Prism license. You can sign up for free and make dot plots with the free daily credits. R with ggplot2 and the free web app PlotsOfData are other options.
Upload the data behind the bar chart and ask for a dot plot of every value with the mean ± SD or the median. Weissgerber and colleagues (PLOS Biology 2015) reviewed 703 papers in top physiology journals and found at least one bar graph in 85.6% of them; they showed that very different data sets can give the same bar, which is why reviewers ask. With fewer than about 20 values per group, plot every point; with more, overlay the points on a box or violin plot. Keep the statistic and test you report in the text.
Yes, when it computes from your numbers. FigCanvas reads your file and computes means, SDs and tests in Python before plotting, so every dot is a real value and the figure can be reproduced; an image generator would draw dots that are not your data.
Long format: one row per measurement with a group column and a value column. Wide tables with one column per group, as in a Prism column table, are reshaped for you. For a bubble dot plot, use one row per gene and cluster with average expression and percent of cells expressing.
Yes. Name the comparison in the prompt, for example “each group against Control”. For two groups FigCanvas can run Welch’s t-test or Mann-Whitney; for three or more, ANOVA or Kruskal-Wallis with a post hoc test such as Dunnett’s or Tukey’s, which correct for multiple comparisons. Stars follow the usual cutoffs: * P < 0.05, ** P < 0.01, *** P < 0.001, **** P < 0.0001.
Yes; say which in the prompt and in the legend. SD shows how variable the data are; SEM, which is SD divided by √n, shows how precisely the mean is estimated, and with n = 10 it is about 0.32 times the SD, so SEM bars look much tighter. For skewed data, ask for the median and interquartile range.
Yes. Upload one row per gene and cluster with average expression and percent of cells expressing, and ask for a bubble dot plot like Seurat’s DotPlot: dot size is the percentage of cells expressing the gene, and color is the average expression scaled per gene (Seurat clips it at −2.5 and 2.5 by default). In the PBMC example above, each cluster’s own markers are expressed in 74–97% of its cells.
Pro and Credit Pack users export editable SVG and 300 DPI PDF, so labels and fonts can be adjusted in Illustrator or Inkscape to the journal’s guidelines; free exports are watermarked PNG. If the journal asks for TIFF, export a PNG and convert it with the free FigCanvas PNG to TIFF converter.
GraphPad Prism is the usual choice in biology labs (a scatter dot plot with mean and SD), but it needs a paid license. In R, ggplot2 with geom_jitter or ggbeeswarm plus stat_summary draws the same figure; in Python, seaborn.stripplot or swarmplot. PlotsOfData is a free web app for it. FigCanvas makes the dot plot from a CSV and a description in plain language, adds computed P values, and exports editable SVG.
Not directly: Excel has no dot plot of individual values. Give each group an x position (1, 2, 3), add a small random offset with =1+(RAND()-0.5)*0.3, and plot the values as an X Y scatter chart; then add the group means as a second series with custom error bars for the SD. To skip that, upload the same sheet to the FigCanvas dot plot generator.
Make a dot plot from your data
Upload your measurements, get every data point with mean ± SD and computed P values, or a bubble dot plot of marker genes, then export it for your paper.
More AI tools for scientific figures
View all tools →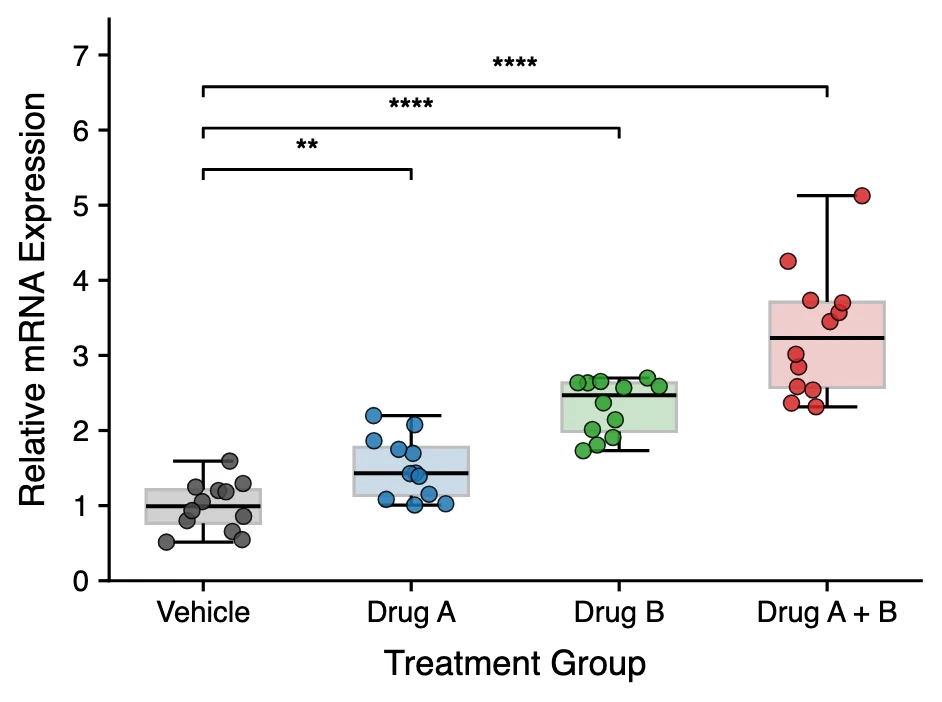
Box Plot Maker
Box and whisker plots with individual data points and significance brackets computed from your data.
Open tool →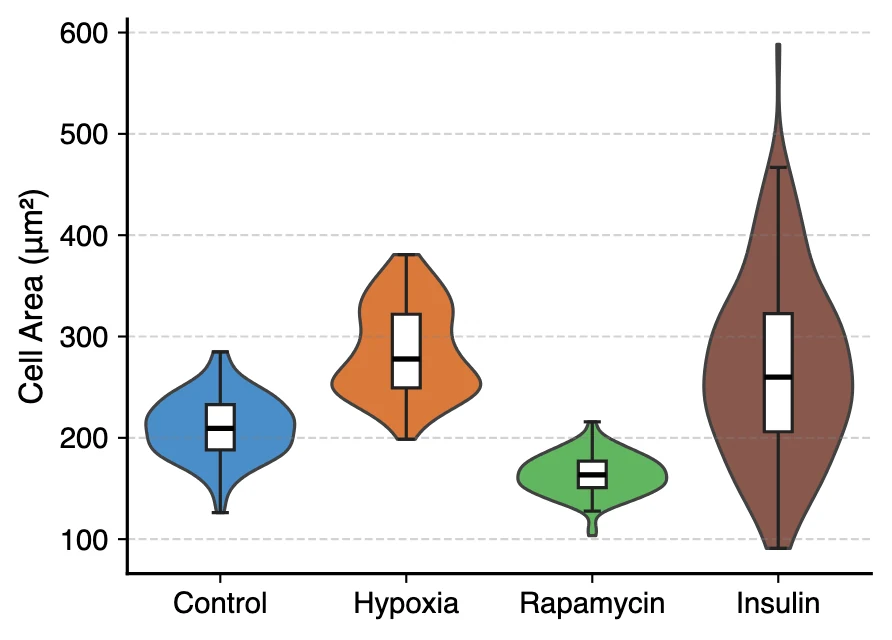
Violin Plot Maker
Violin plots with embedded box plots, split violins and stacked violins for single-cell marker genes.
Open tool →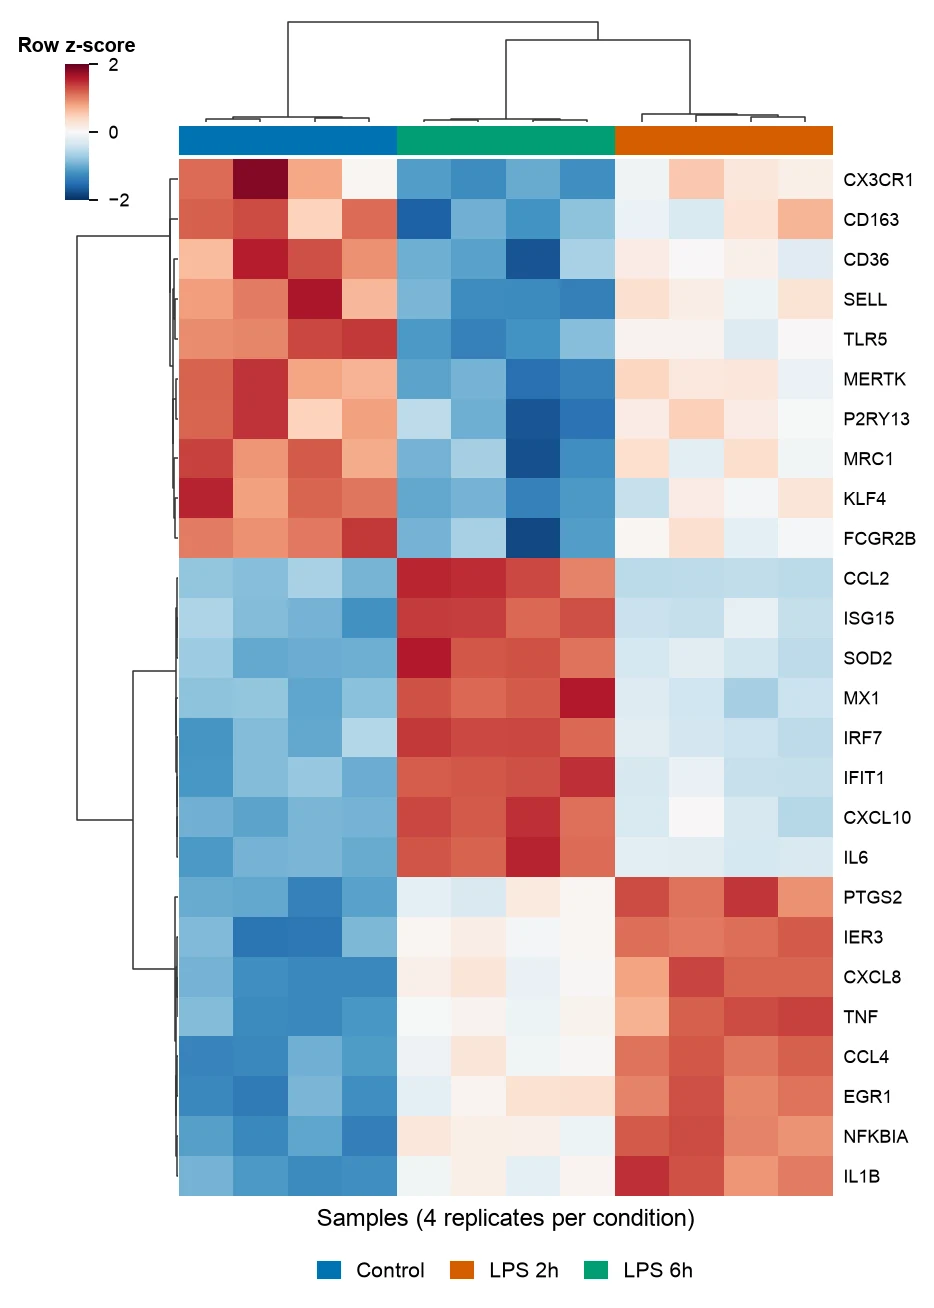
Heatmap Generator
Clustered gene expression heatmaps with z-scored rows and dendrograms, and correlation heatmaps of any numeric table.
Open tool →