
Convert PNG to TIFF
at 300 DPI for journals
Turn PNG, JPEG or WebP figures into LZW-compressed TIFFs at 300, 600 or 1000 DPI. Keep every pixel, or resize to a journal column width. Convert one figure or a whole batch.
- Free, no sign-up
- Lossless LZW compression, RGB
- Transparency flattened onto white
- Runs in your browser: nothing is uploaded
Convert PNG or JPEG to TIFF
Drop one or more figures here (PNG, JPEG or WebP, up to 20 at once) and get LZW-compressed TIFFs at 300, 600 or 1000 DPI.
Processed in your browser. Files are never uploaded.
What changes when a PNG becomes a TIFF
A two-panel figure exported 180 mm wide with 2125 × 826 pixels, saved as a PNG labelled 72 DPI, the way many screenshots and slide exports arrive. At 72 DPI it would print 750 mm wide. Converted to a 300 DPI TIFF it keeps every pixel and prints at the intended 180 mm. With LZW the TIFF is 89 KB; without compression the same pixels take 5.3 MB.
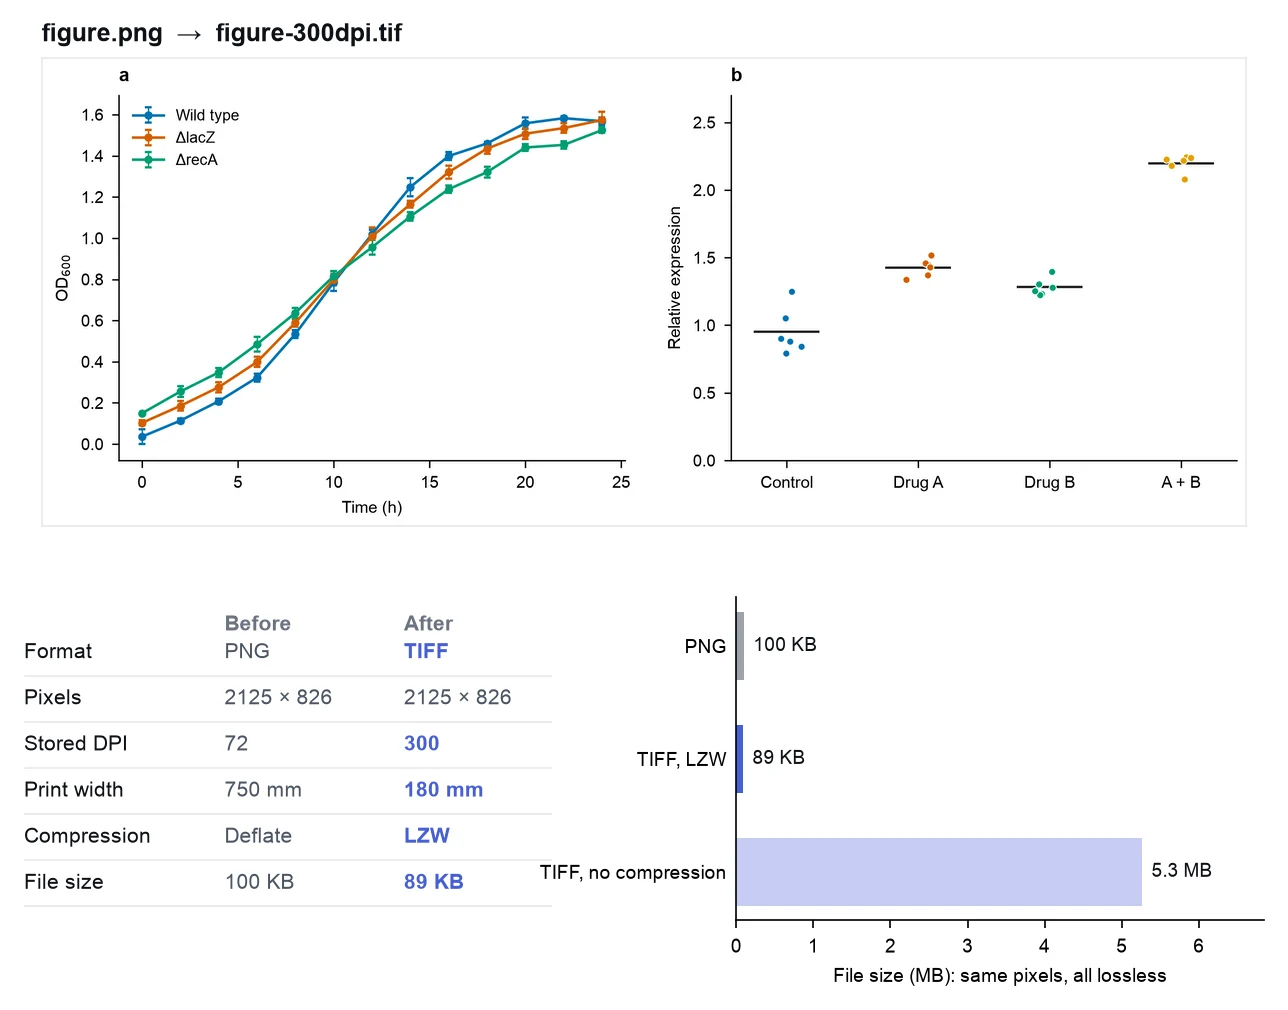
Same pixels, new container
PNG and TIFF are both lossless, so converting one to the other copies every pixel exactly. What changes is the container: TIFF stores the DPI as a resolution tag that submission systems read, and it is the format many journal production teams still ask for.
Why LZW matters
An uncompressed RGB TIFF takes 3 bytes per pixel whatever the image shows, so the figure above grows from a 100 KB PNG to 5.3 MB. LZW compression is lossless and brings the same TIFF down to about 89 KB, because plots are mostly flat colour.
What journals check in a TIFF figure
Requirements differ between publishers, but TIFF figures are usually checked for the same six things. The values below are common ones (from Elsevier’s and PLOS’s artwork guidelines); always read your journal’s instructions for authors.
| Check | Journals usually ask for | This converter |
|---|---|---|
| File format | TIFF (or EPS/PDF for vector art) | Baseline TIFF that Photoshop, ImageJ, GIMP, Preview and libtiff read |
| Resolution | 300 DPI photos, 500 DPI combination (600 at some journals), 1000 DPI line art | 300, 600 or 1000 DPI stored in the file |
| Compression | LZW or none (never JPEG inside TIFF) | LZW; uncompressed only if LZW would be larger |
| Color mode | RGB for most journals | 8-bit RGB. CMYK is not supported |
| Transparency | No alpha channel, no layers | Flattened onto white by default |
| File size | Often capped, e.g. 10 MB per figure at PLOS | LZW keeps plots far under typical caps |
| Final figure width | at 300 DPI | at 600 DPI |
|---|---|---|
| Single column, 85 mm | 1004 px | 2008 px |
| Single column, 89 mm (Nature) | 1051 px | 2102 px |
| Double column, 180 mm | 2126 px | 4252 px |
Minimum pixel width = width in mm ÷ 25.4 × DPI.
Only need to fix the DPI of a PNG or JPEG without changing its format? Use the image DPI converter, which rewrites the DPI field and leaves the pixels alone. Making the figure in FigCanvas? Export a PNG and convert it here; the export formats guide shows how to get vector SVG or PDF, EPS and 600 DPI files for submission.
PNG to TIFF FAQs
Drop the PNG into the converter at the top of this page, pick 300, 600 or 1000 DPI and click Convert. You get an LZW-compressed RGB TIFF with the DPI stored in the file, ready to upload. You can add up to 20 PNG, JPEG or WebP files at once, and nothing is uploaded: the conversion runs in your browser.
Yes. Drop up to 20 PNG, JPEG or WebP files into the converter, choose one DPI for all of them, and download each TIFF or all of them in one go. Each file keeps its name with the DPI added, for example figure1-300dpi.tif. The conversion runs in your browser, so nothing is uploaded and there is no account or watermark.
No. PNG and TIFF with LZW are both lossless, so in "Keep pixels" mode the TIFF holds exactly the same pixels as the PNG. In the example above, a 2125 × 826 px figure decodes to identical pixels after conversion. Quality changes only if you choose "Resize to print width", which resamples the image. Converting a JPEG keeps whatever compression artefacts the JPEG already has.
Measured at the final printed size, the common minimums are 300 DPI for photographs and micrographs, 500 DPI for images that combine pictures with text (some journals ask for 600), and 1000 DPI for line art such as graphs (these are Elsevier’s values). PLOS asks for 300 to 600 DPI. Check your journal’s artwork guidelines, then choose that DPI in the converter.
Divide the printed width in mm by 25.4 and multiply by the DPI. An 85 mm single-column figure needs 1004 px at 300 DPI or 2008 px at 600 DPI; a 180 mm double-column figure needs 2126 px at 300 DPI or 4252 px at 600 DPI. The "Resize to print width" option in the converter does this calculation for you.
Yes. LZW (Lempel–Ziv–Welch) replaces repeated byte sequences with short codes, and decoding rebuilds the original bytes exactly. It is part of the TIFF 6.0 specification (Compression = 5), so Photoshop, ImageJ, GIMP, macOS Preview and libtiff-based production systems all read it. It is not the same as JPEG compression inside a TIFF, which is lossy and which journals usually reject.
Most likely it was saved without compression. An uncompressed RGB TIFF stores 3 bytes per pixel, so a 2126 × 1500 px figure is 9.6 MB whatever it shows, and a 2250 × 2625 px figure is 17.7 MB, over the 10 MB per-figure limit PLOS sets. PNG uses Deflate with row filters, which usually compresses a little better than LZW. With LZW, the plot in the example is about 89 KB against 100 KB as PNG and 5.3 MB uncompressed. Photos compress far less than plots.
In Photoshop, set Image > Mode to RGB Color, 8 Bits/Channel, check the resolution under Image > Image Size with Resample unticked, then use File > Save a Copy, choose TIFF and select LZW under Image Compression. In GIMP, set the resolution under Image > Print Size, then File > Export As, name the file figure.tif and choose LZW in the TIFF dialog. To skip the installs and convert several files at once, use the free FigCanvas PNG to TIFF converter.
Open the PNG in Preview, set the resolution under Tools > Adjust Size with Resample image unticked, then choose File > Export, set Format to TIFF and Compression to LZW, and untick Alpha to drop transparency. Preview converts one file at a time; the FigCanvas PNG to TIFF converter does a batch with the same DPI in one go.
Run magick figure.png -background white -alpha remove -alpha off -units PixelsPerInch -density 300 -compress LZW figure.tif (use convert instead of magick on ImageMagick 6). -density sets the stored DPI without resampling, and -alpha remove flattens transparency onto white. For a few figures without the command line, the FigCanvas PNG to TIFF converter writes the same kind of file in your browser.
Only if the image already has enough pixels. Changing the stored DPI does not add detail: an 85 mm column at 300 DPI needs 1004 px across, so a 600 px wide PNG stays too small whatever its label says. If the pixels are short, export the figure again from the original software at a larger size, or as SVG or PDF. Upsampling passes the pixel check but leaves the figure blurry.
For one file, macOS Preview or GIMP is enough; for batches, ImageMagick. Most online converters upload your figure to their server, which matters for unpublished data. The FigCanvas PNG to TIFF converter is free, needs no sign-up and runs in your browser: it converts up to 20 files at once to LZW-compressed TIFFs at 300, 600 or 1000 DPI, and nothing is uploaded.
Not from this tool: browsers only work in RGB, so the converter writes 8-bit RGB TIFFs. Most journals, PLOS among them, ask for RGB figures and handle print conversion themselves. If a journal insists on CMYK, convert the TIFF in Photoshop (Image > Mode > CMYK Color) and check the colours before submitting.
More AI tools for scientific figures
View all tools →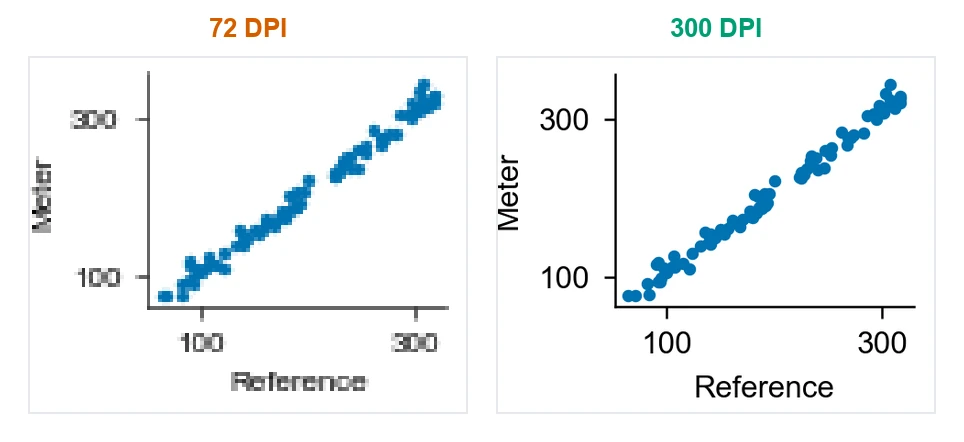
Image DPI Converter
Check an image’s DPI and change it to 300, 600 or 1000 for journal submission, with PNG, JPEG and TIFF output.
Open tool →Scientific Color Palette Generator
Okabe-Ito, Viridis, ColorBrewer and Nature, Science, Cell and PNAS palettes for plots, diagrams and multi-panel figures.
Open tool →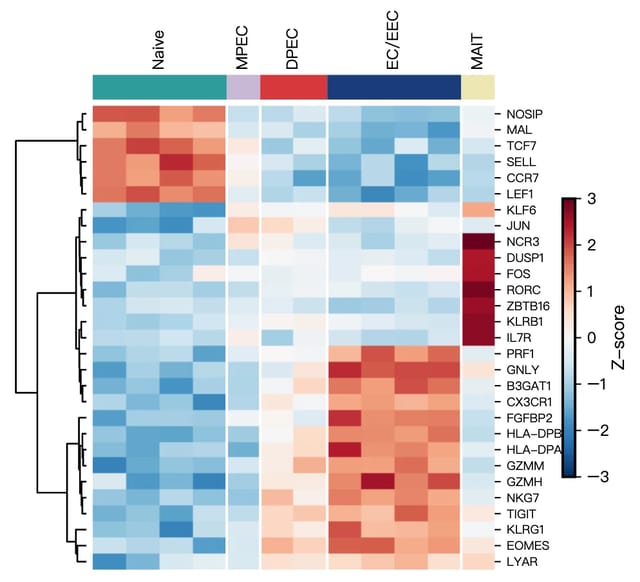
Scientific Data Visualization
Heatmaps, PCA, violin and bar charts for researchers, generated from CSV or Excel data.
Open tool →